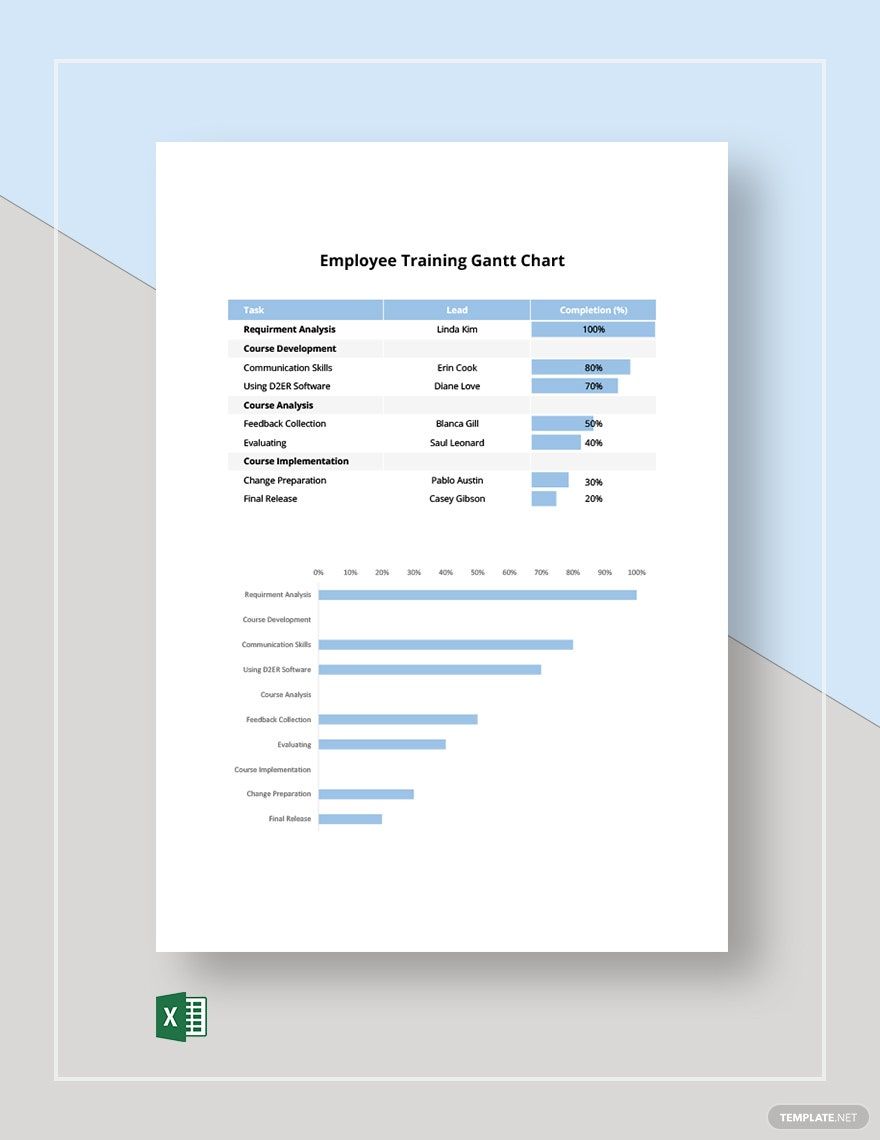
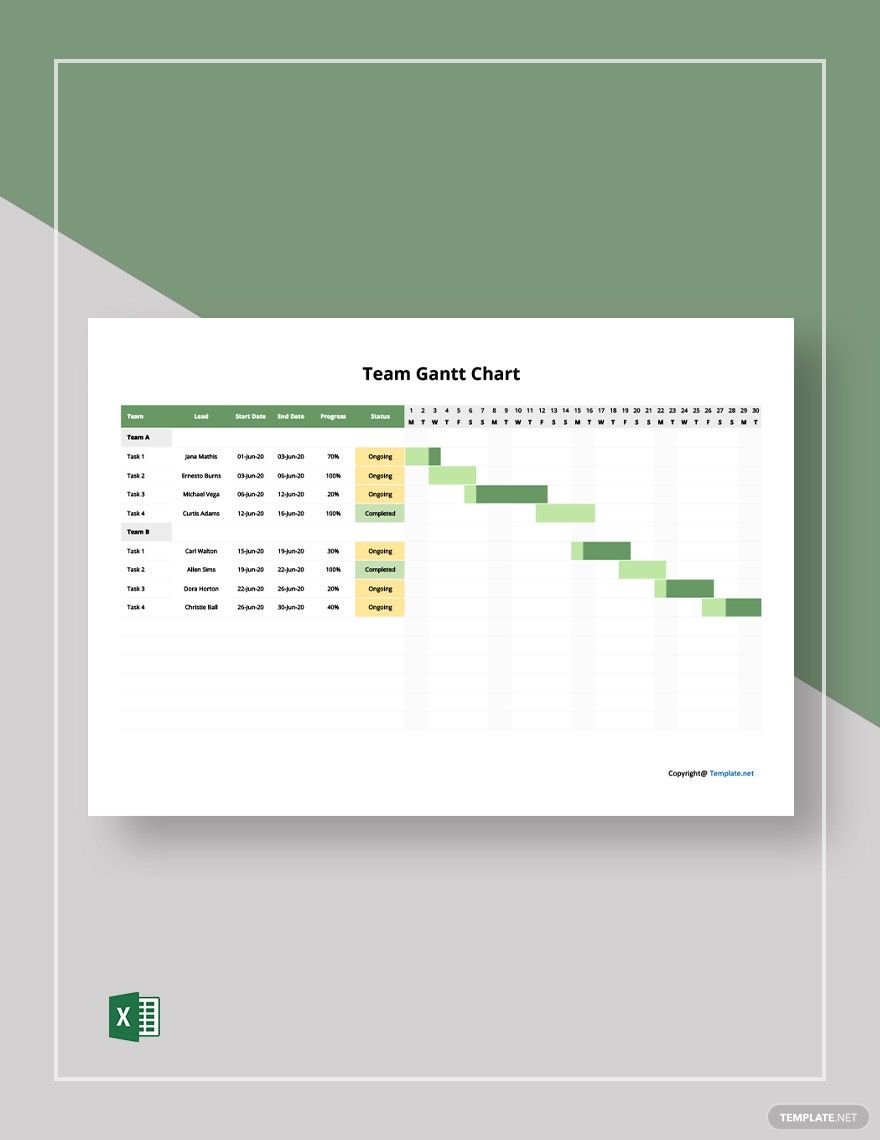
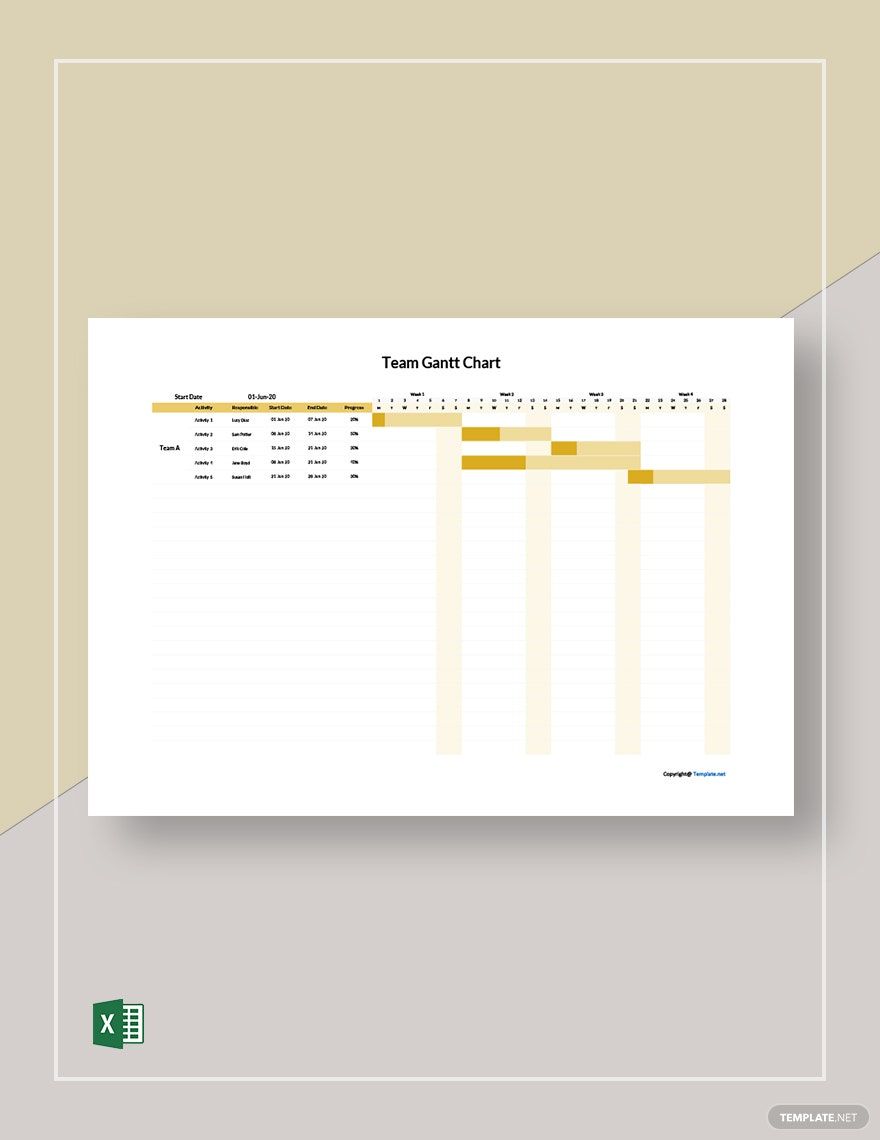
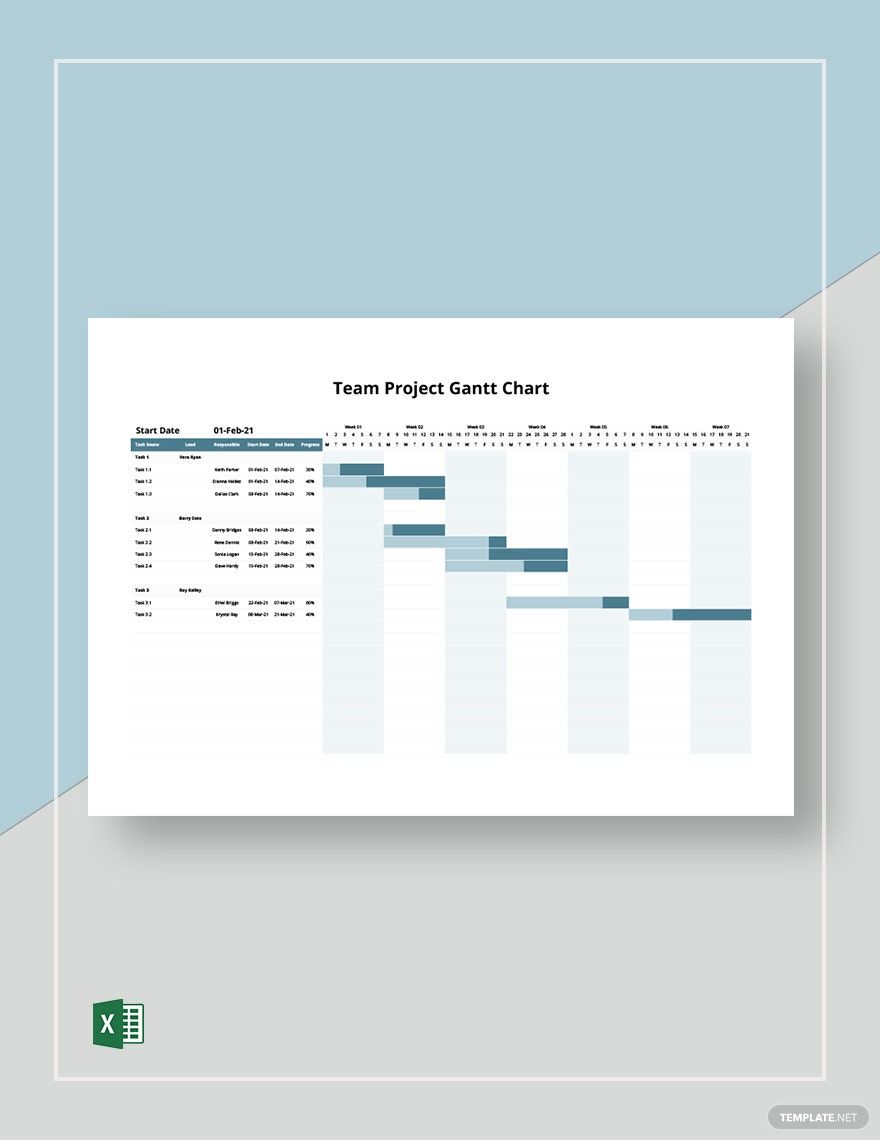
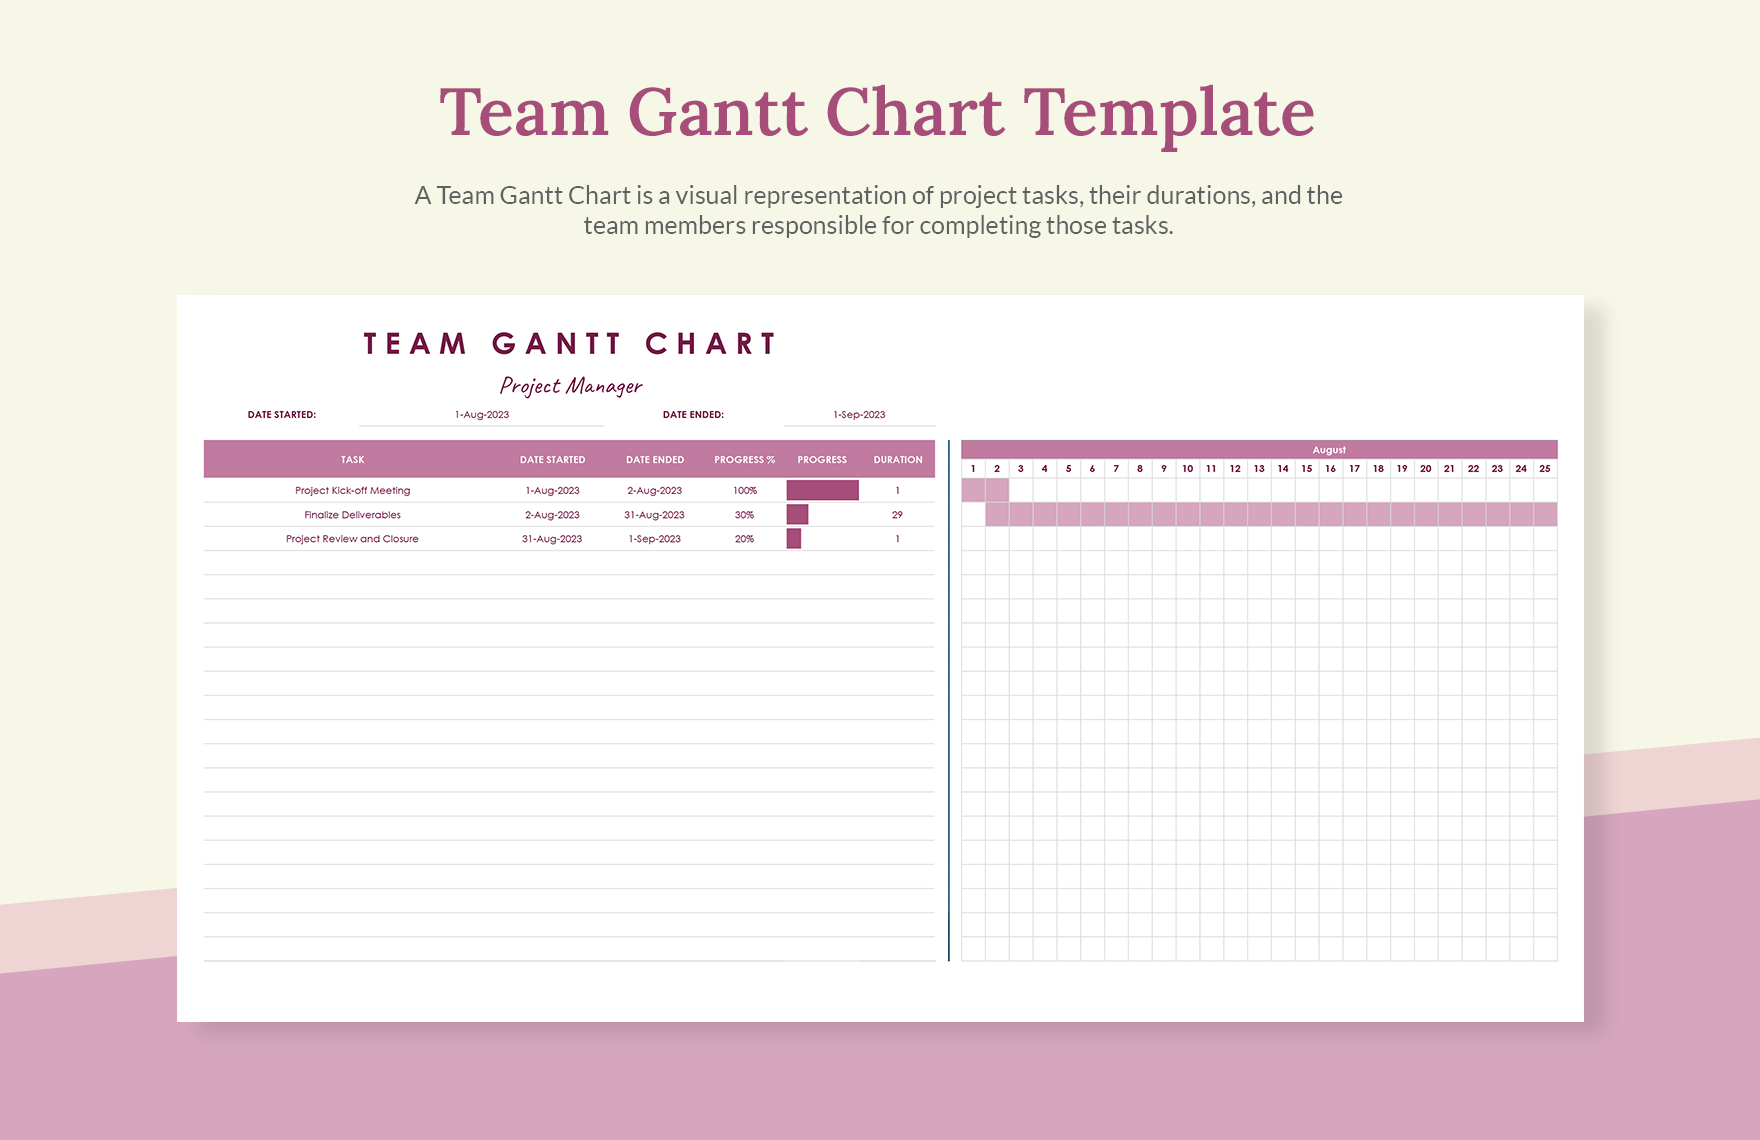
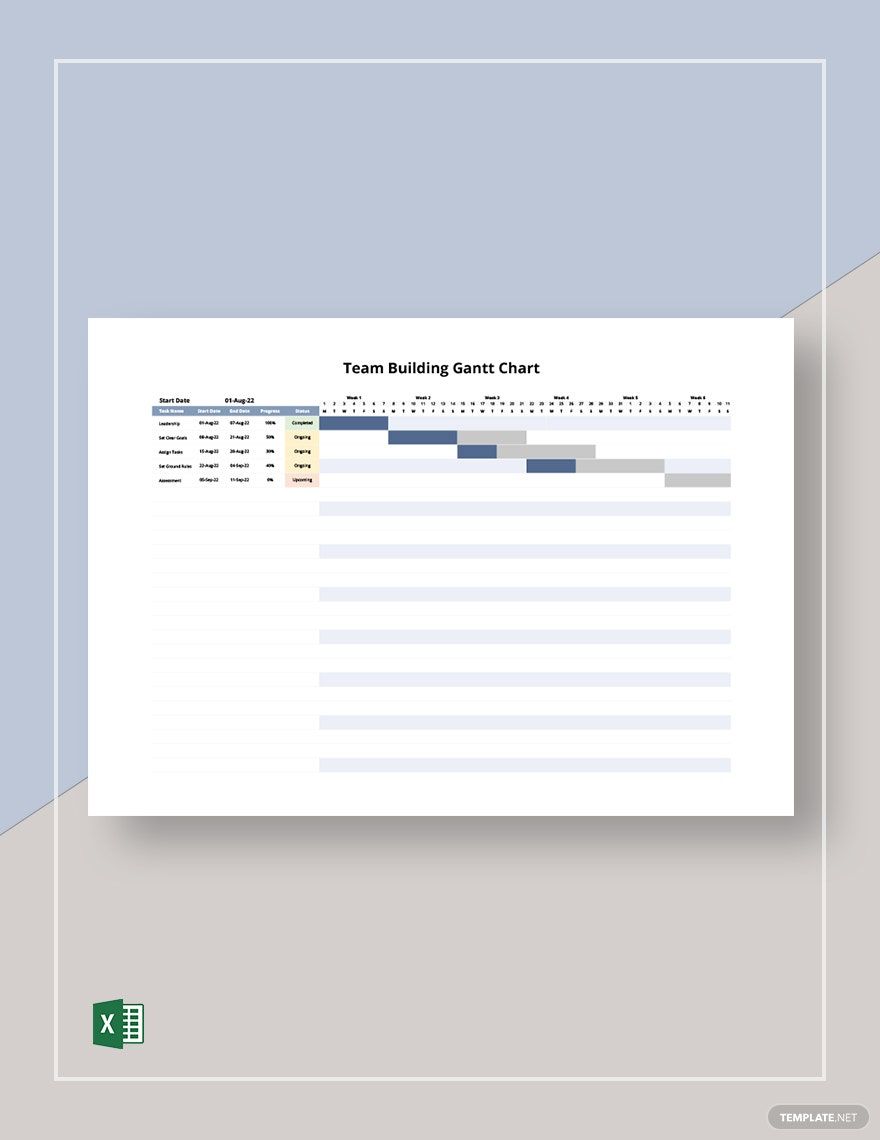
Juggling numerous tasks at once can be difficult, especially if these tasks constitute any number of people, projects, and tasks. When it comes to project management, you are in charge of an entire team of players that need to work together to finish the tasks on hand. In cases like these, having a visual overview of the project schedule is important so that you can take note of every activity and the persons in charge of each of them. This is where Gantt charts can be useful. Fortunately, our website offers numerous customizable Team Gantt Charts Templates in Excel format for you to use. Simply download your file of choice and edit to fit your needs. Sign up to gain access to our file library now.
Team Gantt Chart Template in Excel
No Need to Download a Chart Software! Choose Template.net as Your Reliable Chart Maker with These Free Team Gantt Chart Excel Templates. With Our Project Gantt Charts, Have Better Project Management by Setting Timelines and Tasks. Each Chart Contains Elements, Like a Bar Chart, Perfect for Agile Project Planning and More. Explore Our Sheet Templates in Google Docs, Too. Subscribe!
- Project Report
- Commercial Invoice
- Hr budget
- Reconciliation
- Grade Sheet
- Hotel budget
- Manufacturing
- Career roadmap
- Construction quotation
- Real estate
- Schedule
- Reports
- Inventory
- Hr dashboard
- Restaurant spreadsheets
- List
- Ecommerce
- Analysis
- Report Cards
- Travel agency
- Hr calendar
- Travel quotation
- Call Logs Sheet
- Maintenance
- Construction bid
- Contractor estimate
- Project roadmap
- Medical invoice
- Product roadmap
- Daily Report
- Documents
- Notes
- Repair estimate
- Attendance Sheet
- Church
- Catering
- Hr templates
- Rental
- Rent Receipts
- Medical
- Student budget
- Vehicle invoice
- Construction cost estimate
- Annual Report
- Overtime sheet
- School invoice
- Monthly Reports
- School Reports
- Charts
- Business itinerary
- Construction schedule
- Marketing gantt chart
- Dissertation gantt chart
- Balance sheet
- Restaurant budget templates
- Gantt Charts
- Customer
- Hotel invoice
- Travel agency invoice
- Kitchen cleaning schedule
- Food budget
- Restaurant receipts
- Preventive maintenance schedule
- Construction
- Event gantt chart
- Catering invoice
How to Create Team Gantt Charts
A Gantt chart is useful for projects that require a lot of planning. This chart illustrates project schedules and they represent important information, including who is assigned to which task, the duration of each task, and overlapping activities that should be kept track of. When done correctly, Gantt charts make the perfect tools for project management. Here are some things to remember when making team Gantt charts:
1. Gather All the Important Information
When creating a Gantt chart, you have to begin by gathering all important information such as the list of all tasks and the persons in charge of each task, the estimated timeline or duration of each task, and decide which tasks stand on their own and which ones depend on the progress of others.
2. Plot the Tasks
When you managed to gather all the necessary information, plot the tasks on the Gantt chart. Most people find having the critical tasks on top so that they are easier to follow as the project progresses. You may also divide the tasks into more manageable pieces when necessary.
3. Use Progress Bars
Use a progress bar for each task to help you keep track of the project. A progress bar can be as simple as a horizontal bar next to the task name and should indicate a start and end date. In Gantt charts, progress bars may overlap with each other. However, this is not a problem; it simply means the tasks are occurring at the same time.
4. Emphasize the Milestones of the Project
Milestones are considered as the major events or the largest parts in the process. They are the tasks that need to be completed before the project proceeds to the next step. Indicating milestones is also helpful in helping you see your progress at a glance.
Frequently Asked Questions
What is a Gantt Chart?
A Gantt chart shows a visual overview of tasks for a project, scheduled over time. They are used by teams and project managers to plan their projects.
What is a Gantt chart used for?
A Gantt chart is a production tool that is often used in project management. It illustrates project plans and schedules in a graphical manner and includes details that will help coordinate and track specific tasks in various projects, at different phases.
What is project management?
Project management is a way of organizing and managing resources necessary to complete a project. This process is usually led by the project manager.
What do project managers do?
Project managers plan, execute, and close projects. They also facilitate and manage teams to ensure productivity and give motivation to the members.
What is the critical path in a Gantt chart?
The “critical path” in project management is the longest sequence of dependent tasks that must be completed to keep the project on track. Critical paths can be identified when a delay on the path influences the duration of the project.
