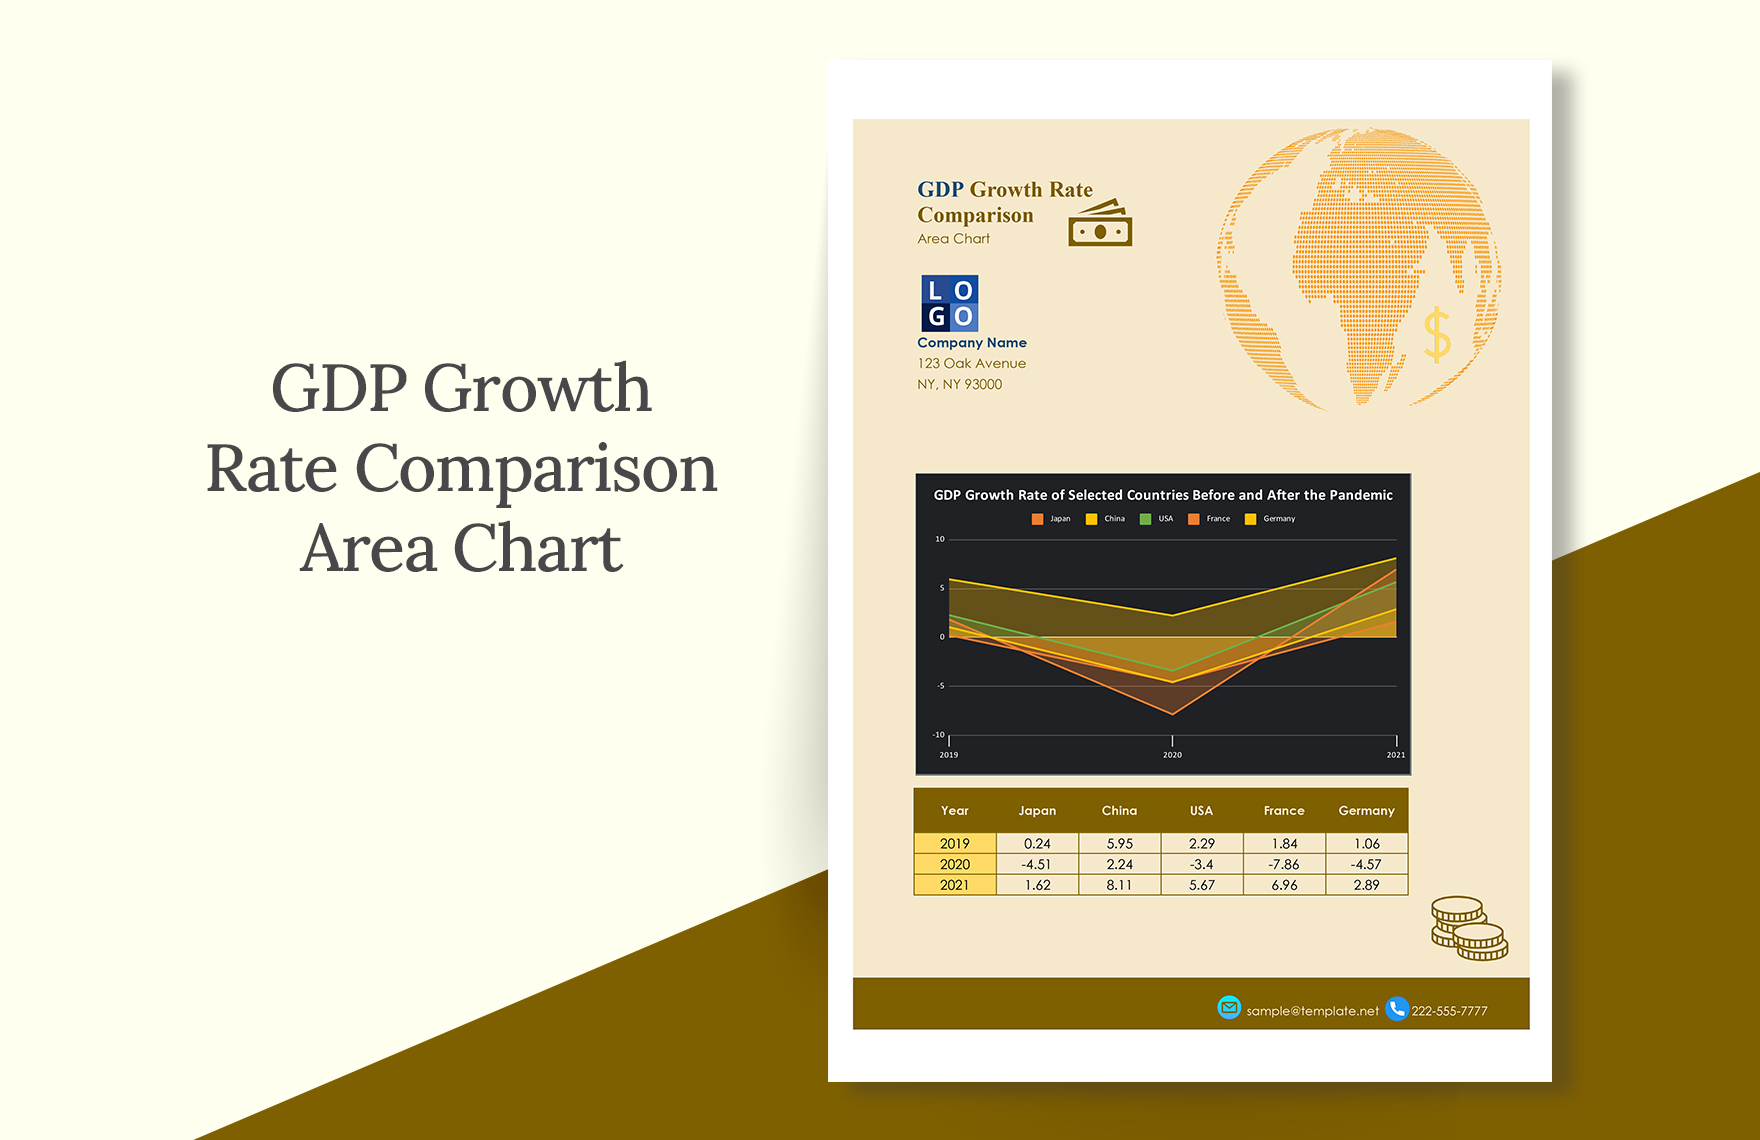
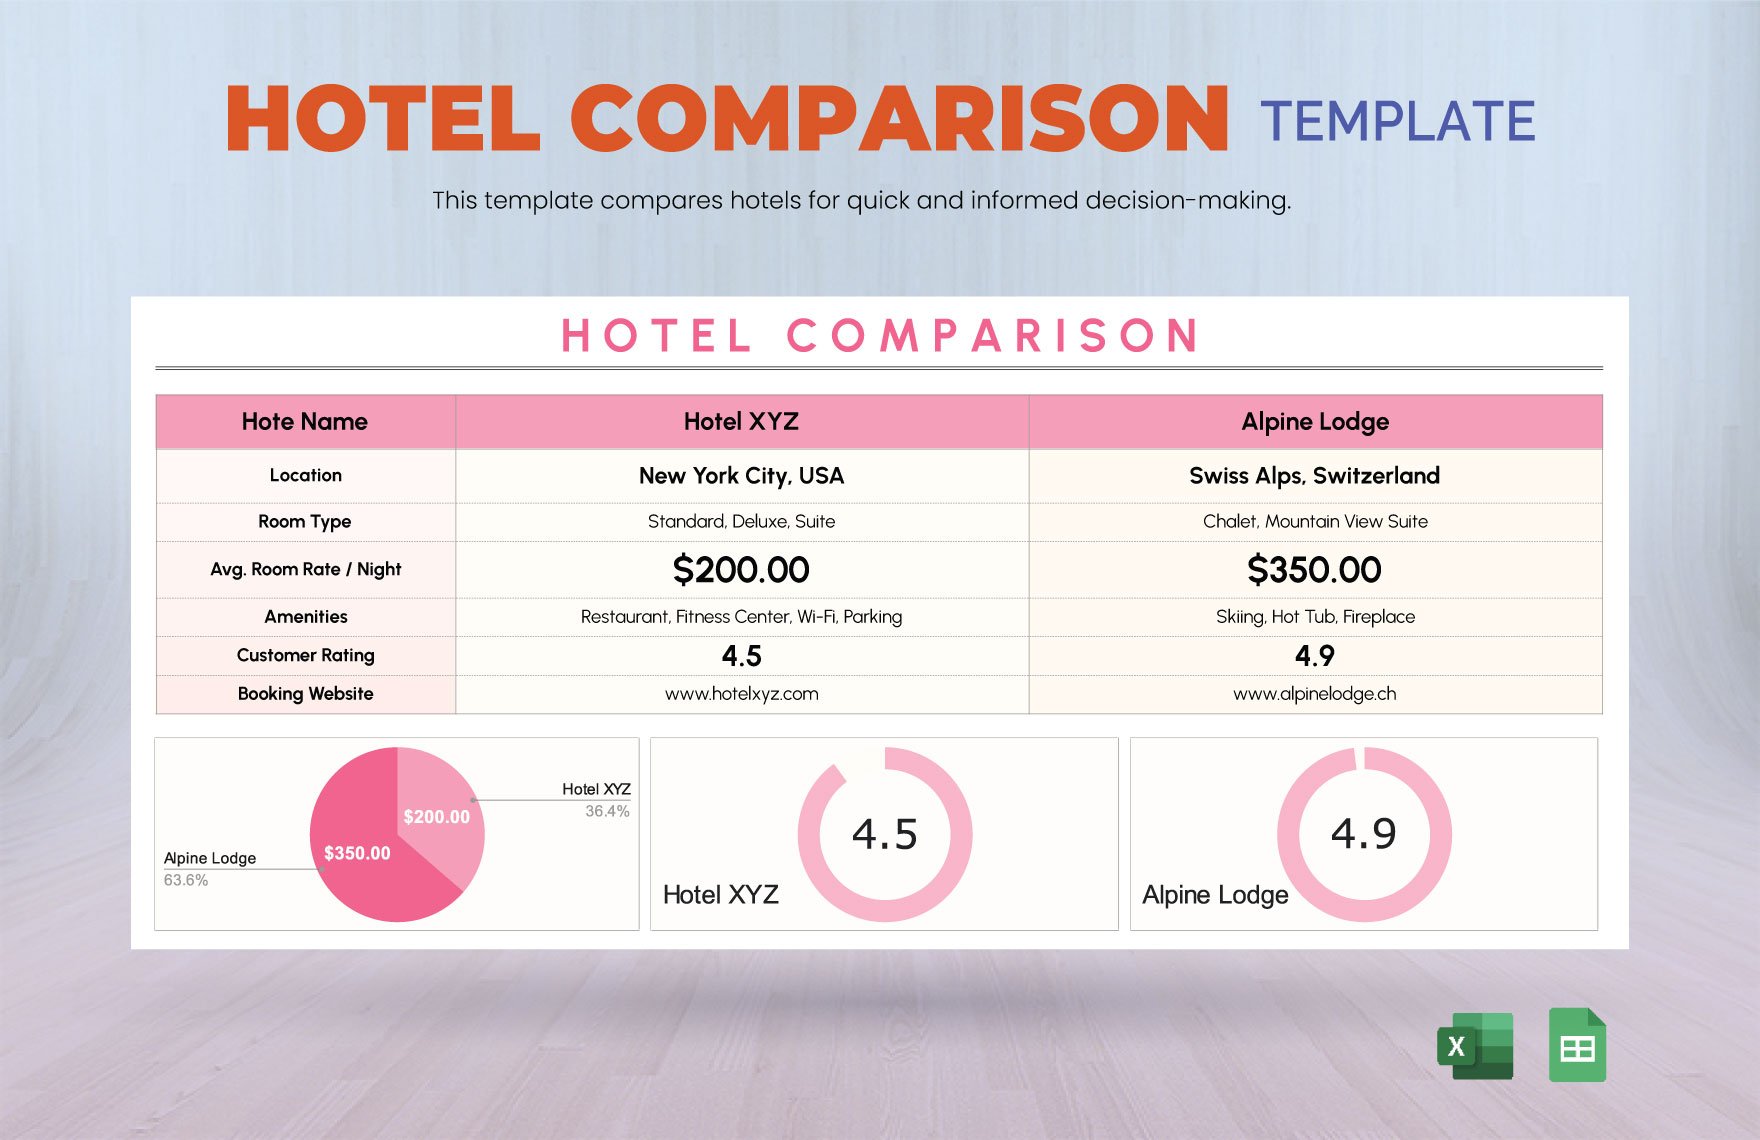
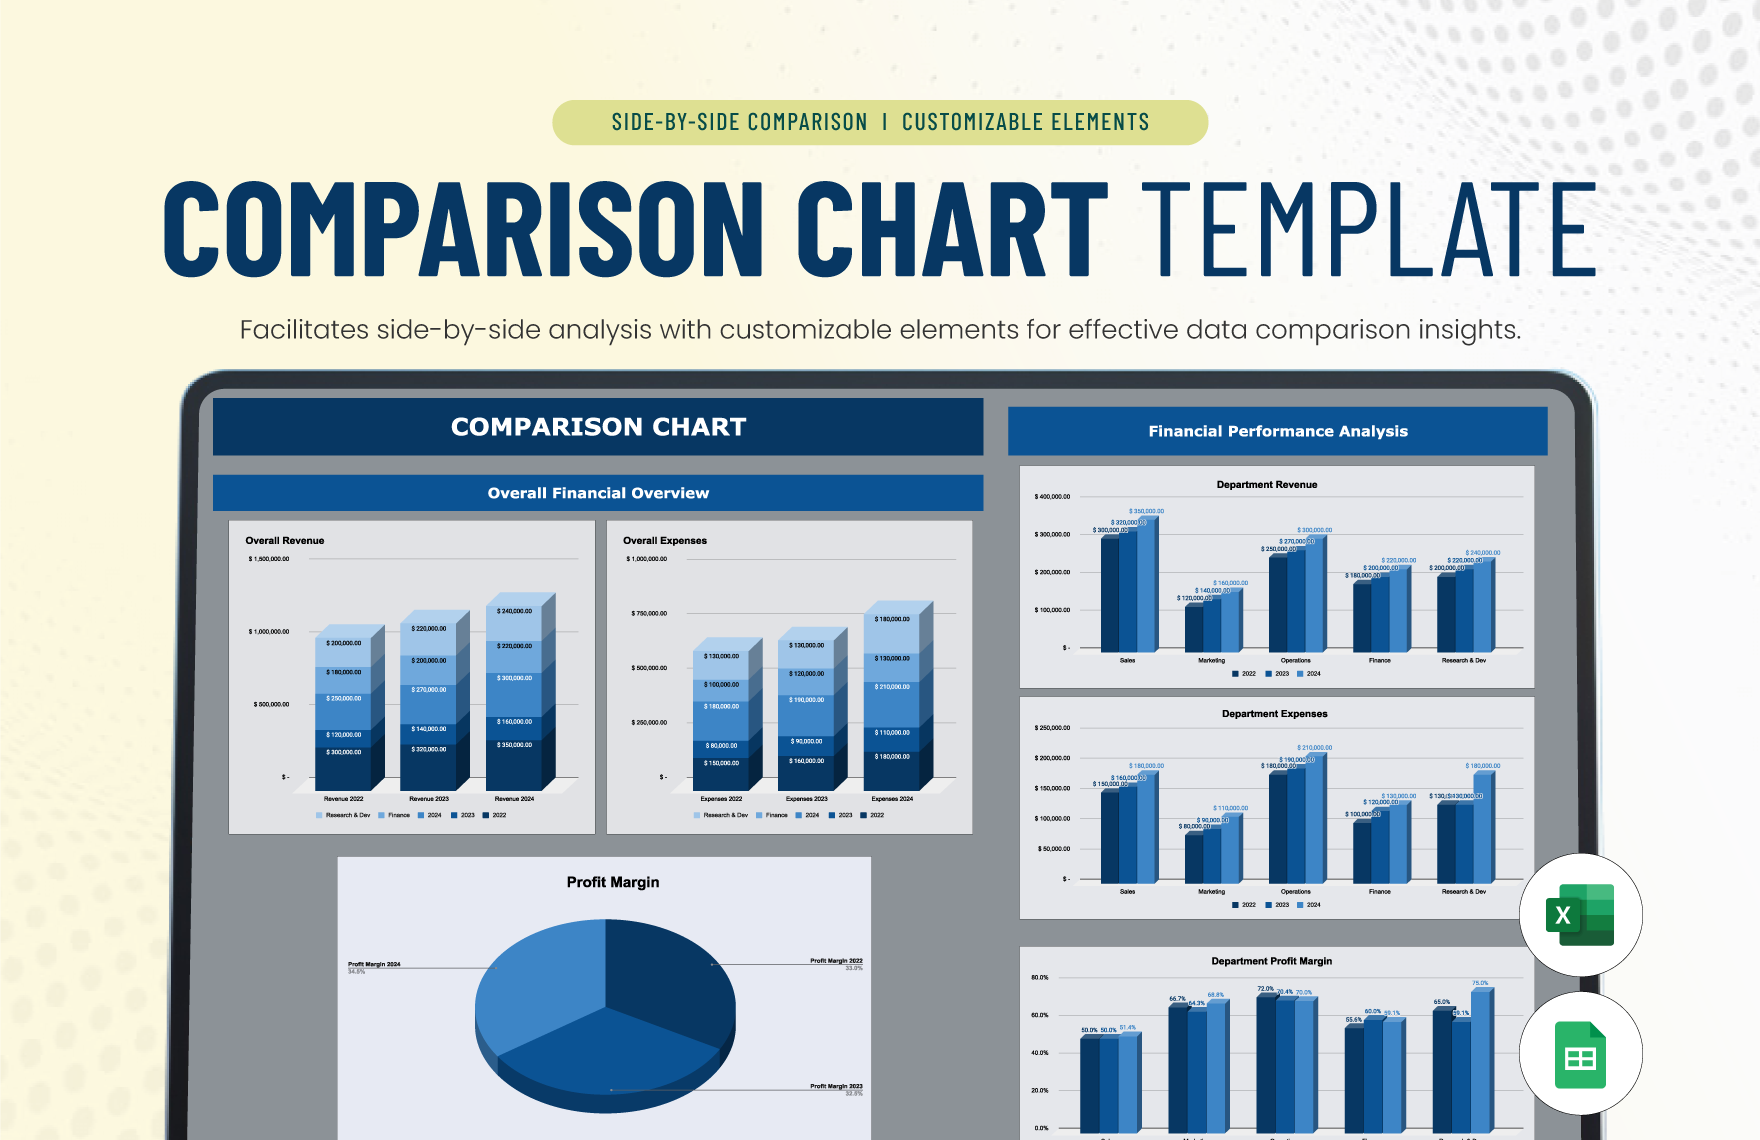
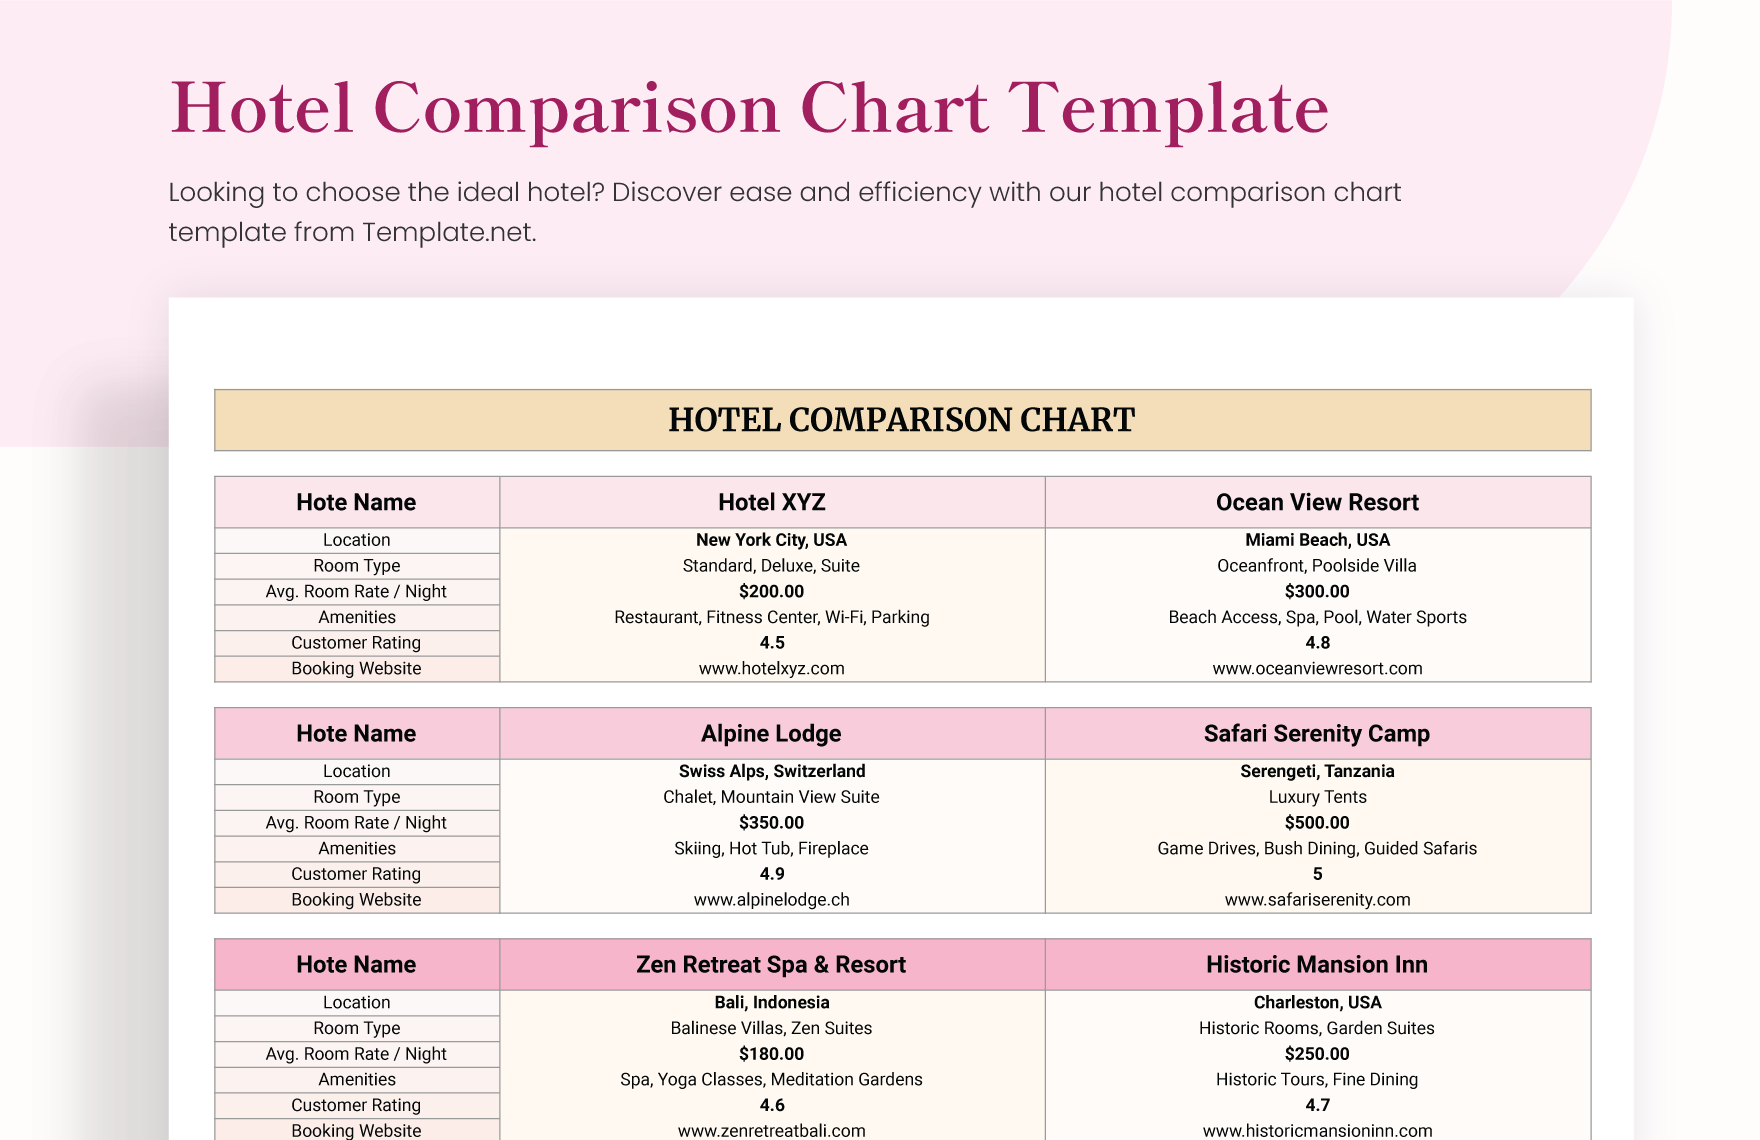
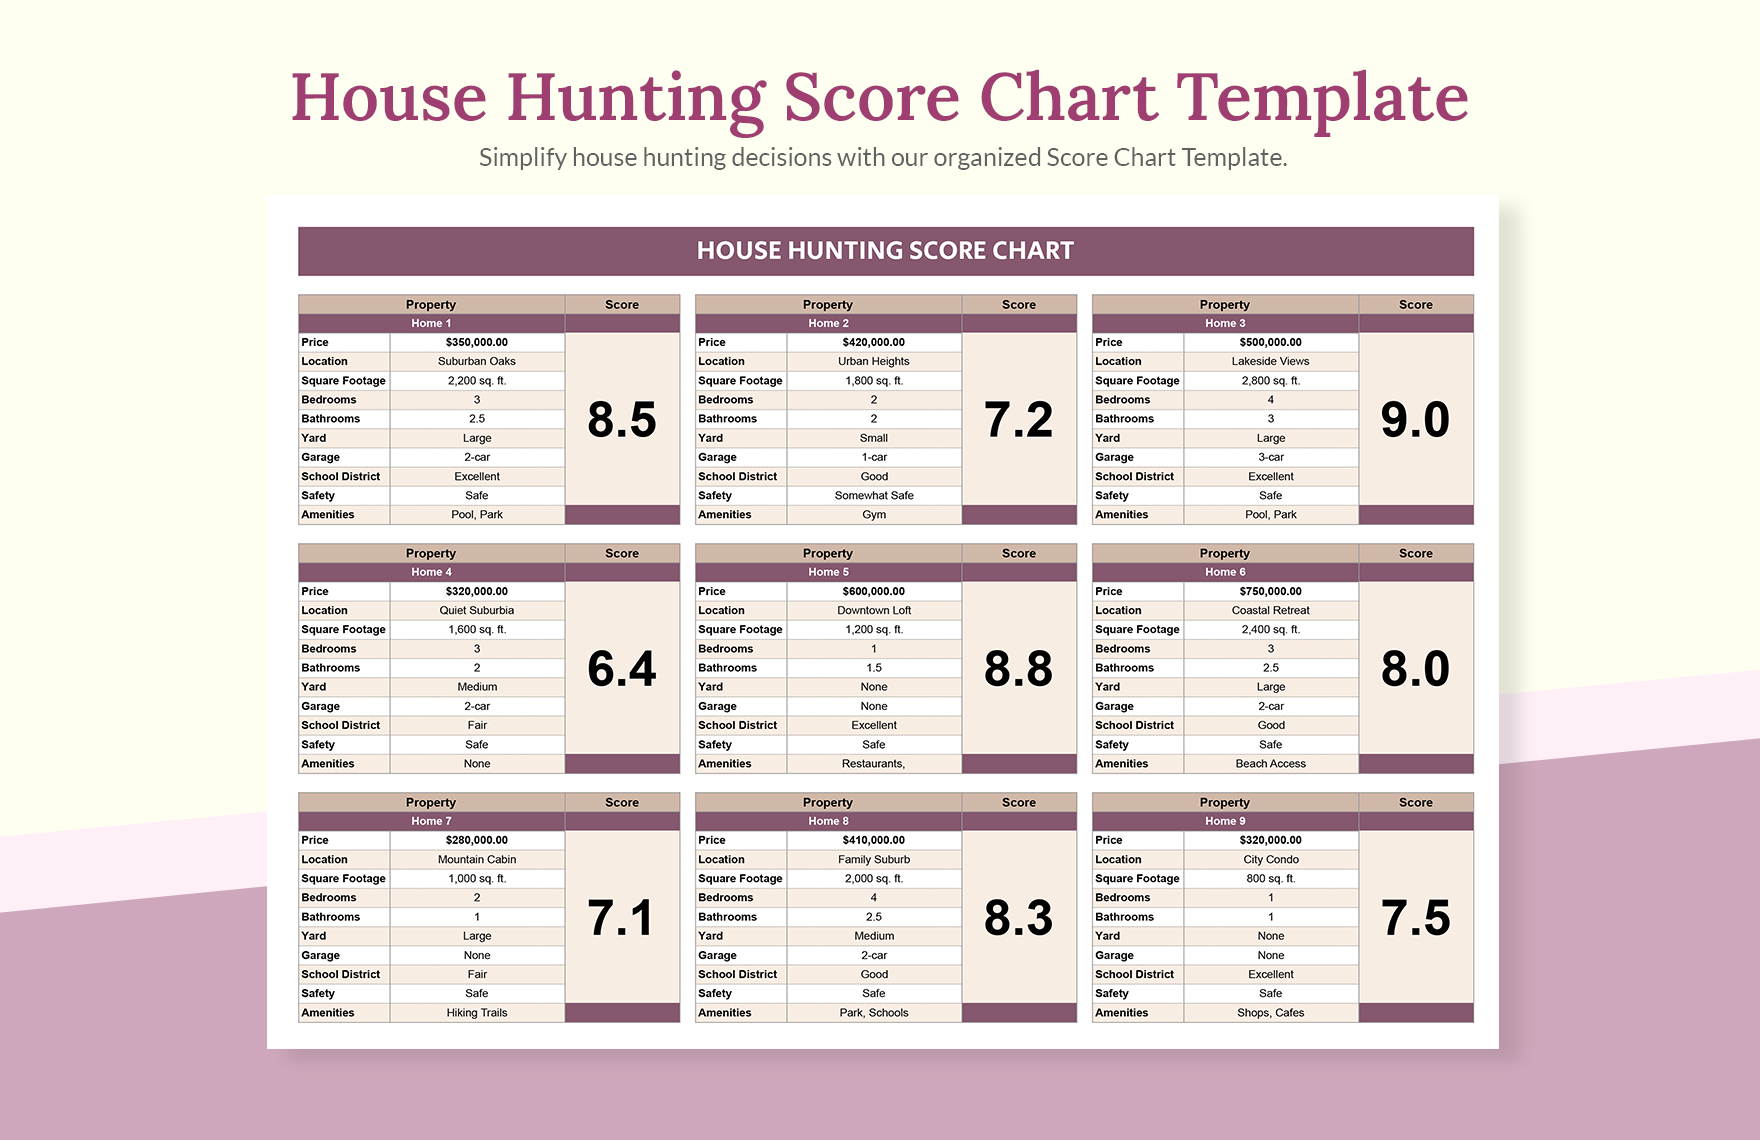
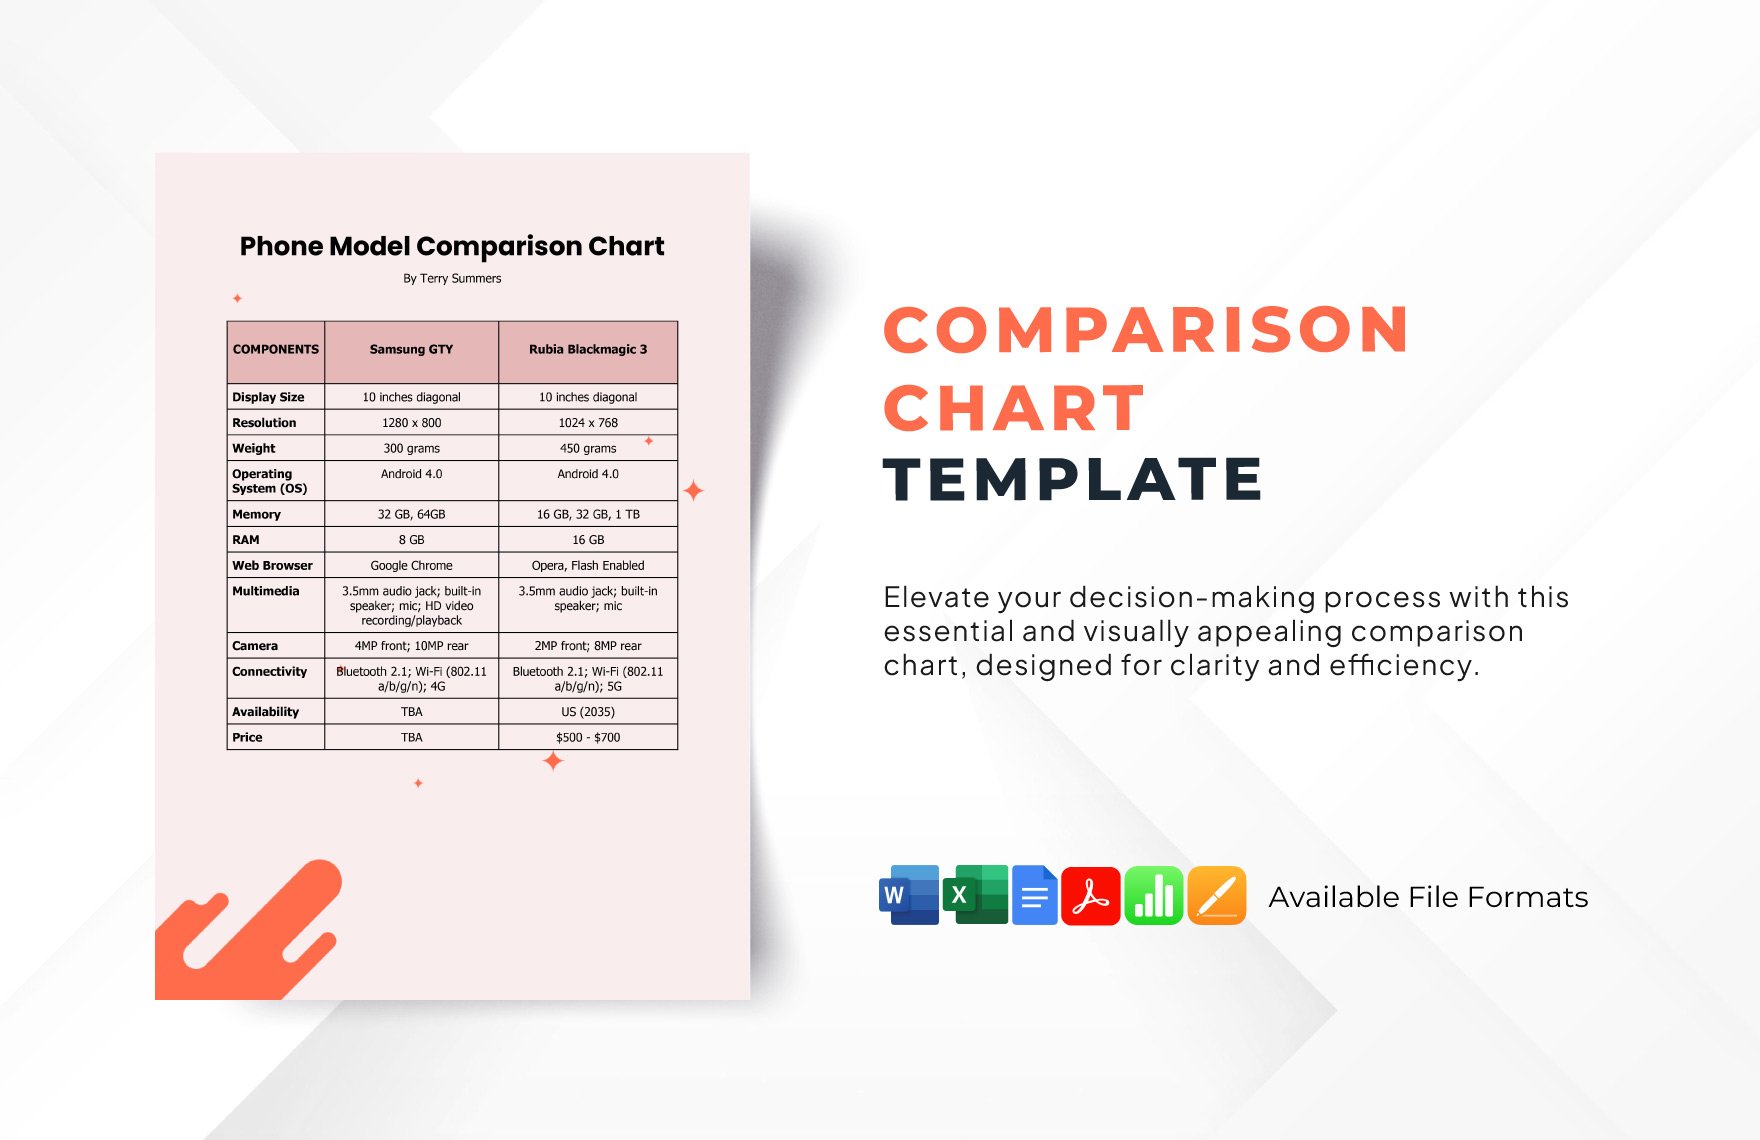
Most people, if not all, won’t bother reading lengthy sentences or reports. For this reason, businesses, as well as individuals, convert statistical data and other information into charts. In the business industry, comparison charts help consumers weigh options more easily. Whether you are an affiliate of a business entity or a member of the academe, there is a comparison chart template specifically tailored for your needs. Displayed on this page are 100% customizable, printable, easily editable, high-quality, and professionally designed chart templates you can download in Microsoft Excel file format. With these templates at your disposal, you get present easily comprehensible contrasting information. Get yours today!
Comparison Chart Template in Excel
Price Comparison Sheet, Matrix Cost Comparison Sheet, Feature Comparison Spreadsheet—There are Many Alternative Tools to Compare Two or More Elements and Template.net's Free Comparison Charts Are Splendid Examples! You Can Create, Edit, and Print Comparison Charts About a Product Cost, Software Feature, School Price, and Many More to Select.
- Project Report
- Commercial Invoice
- Hr budget
- Reconciliation
- Grade Sheet
- Hotel budget
- Manufacturing
- Career roadmap
- Construction quotation
- Real estate
- Schedule
- Reports
- Inventory
- Hr dashboard
- Restaurant spreadsheets
- List
- Ecommerce
- Analysis
- Report Cards
- Travel agency
- Hr calendar
- Travel quotation
- Call Logs Sheet
- Maintenance
- Construction bid
- Contractor estimate
- Project roadmap
- Medical invoice
- Product roadmap
- Daily Report
- Documents
- Notes
- Repair estimate
- Attendance Sheet
- Church
- Catering
- Hr templates
- Rental
- Rent Receipts
- Medical
- Student budget
- Vehicle invoice
- Construction cost estimate
- Annual Report
- Overtime sheet
- School invoice
- Monthly Reports
- School Reports
- Charts
- Business itinerary
- Construction schedule
- Marketing gantt chart
- Dissertation gantt chart
- Balance sheet
- Restaurant budget templates
- Gantt Charts
- Customer
- Hotel invoice
- Travel agency invoice
- Kitchen cleaning schedule
- Food budget
- Restaurant receipts
- Preventive maintenance schedule
- Construction
- Event gantt chart
- Catering invoice
How to Create a Comparison Chart in Microsoft Excel?
With the existence of competition between companies in the business industry, comparisons have become inevitable. Aside from that, there are also instances when we use comparisons to make sound decisions. Differentiating things from one another helps us determine which ones we should prefer. Also, it allows organizations or individuals identify what particular aspect needs improvement. Creating a comparison chart will be beneficial in representing the difference between two or more objects, phenomena, or groups of data neatly. In this short guide, we will walk you five simple ways to make a chart in Microsoft Excel.
1. Gather Information
Before creating a comparison chart, you first need to gather all the information necessary for its completion. Make sure you have the complete list of which particular aspects to consider in comparing certain objects. In the business industry, companies conduct a competitive analysis to assess the strengths and weaknesses of the competitors. It helps business entities plan out a successful marketing strategy, which eventually increases the sales of a company.
For a product comparison or feature comparison, you should have a list of the pros and cons of two (or more) separate item/s. The information you have to collate may include the type of food, stock, height, size, price, reviews, and features.
2. Know the Right Type of Chart to Use
For a chart to fully serve its purpose, it is essential to know the appropriate type of chart to create. Just to give you a heads up, line graphs, bar graphs, and pie charts do not suit well with qualitative data. However, these types of charts can be used to visually represent quantitative data. On the other hand, some details can be simply presented in a tabular form. For a side by side comparison, you can make use of a bar graph for a better graphic presentation of the data.
3. Launch Microsoft Excel
Microsoft Excel is an electronic software program best used to store, organize, and manipulate data. Moreover, it features multiple tools enabling users to create different types of charts such as diagrams, graphs, tables, and infographics.
4. Enter Data
After launching Microsoft Excel, enter the data on the blank sheet provided. Make sure that you have them well-organized to avoid confusion. For numerical figures, you first have to make a table using the cells on the spreadsheet. After which, select the data you want to include in your chart. Then, click Insert > Recommended Charts. On the recommended charts tab, Excel recommends a list of charts which perfectly suits the data you have—select one and click OK.
5. Personalize
If you want to have a creative comparison chart, you may alter the colors of the graph in any you prefer. However, see to it that the chart remains legible and neat. After you do some customizations, proofread the information, finalize the model's design, and save the file. Lastly, bear in mind that the end product of your chart should enable readers or viewers to determine the difference between two or more options immediately.
