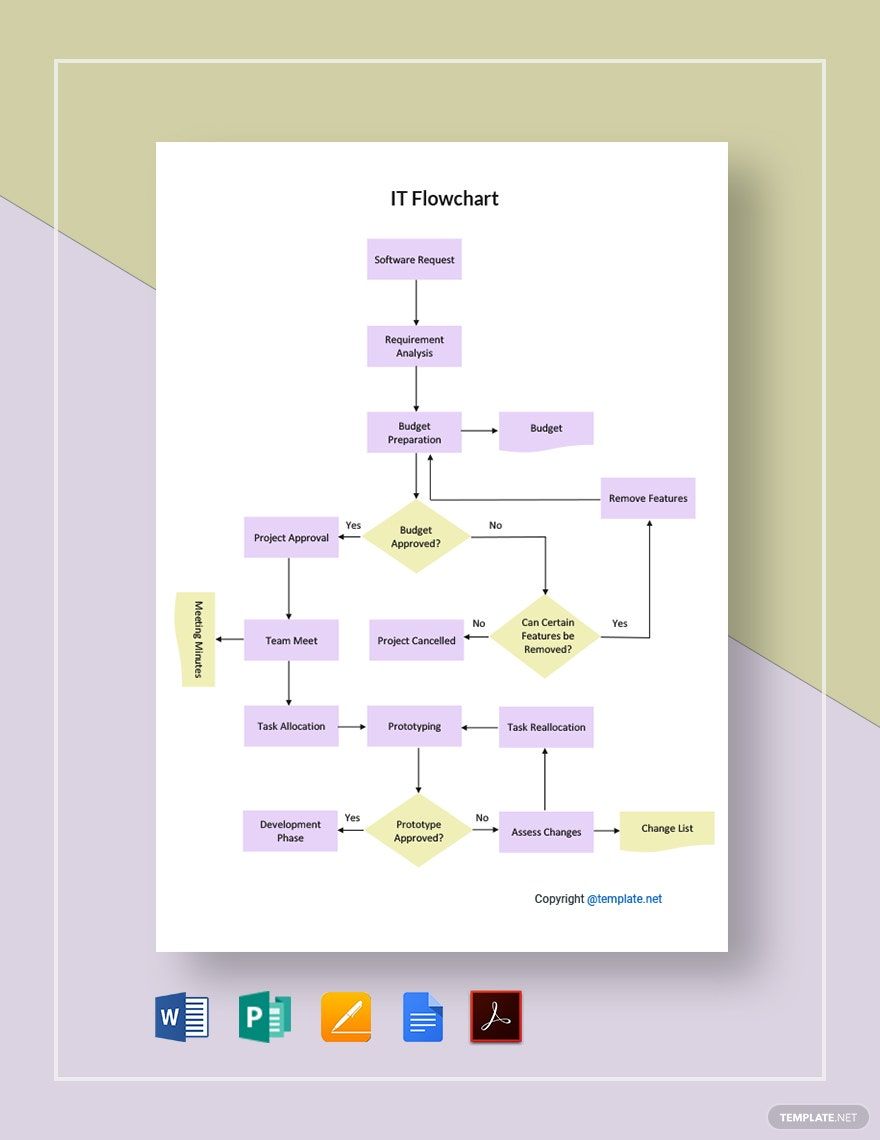
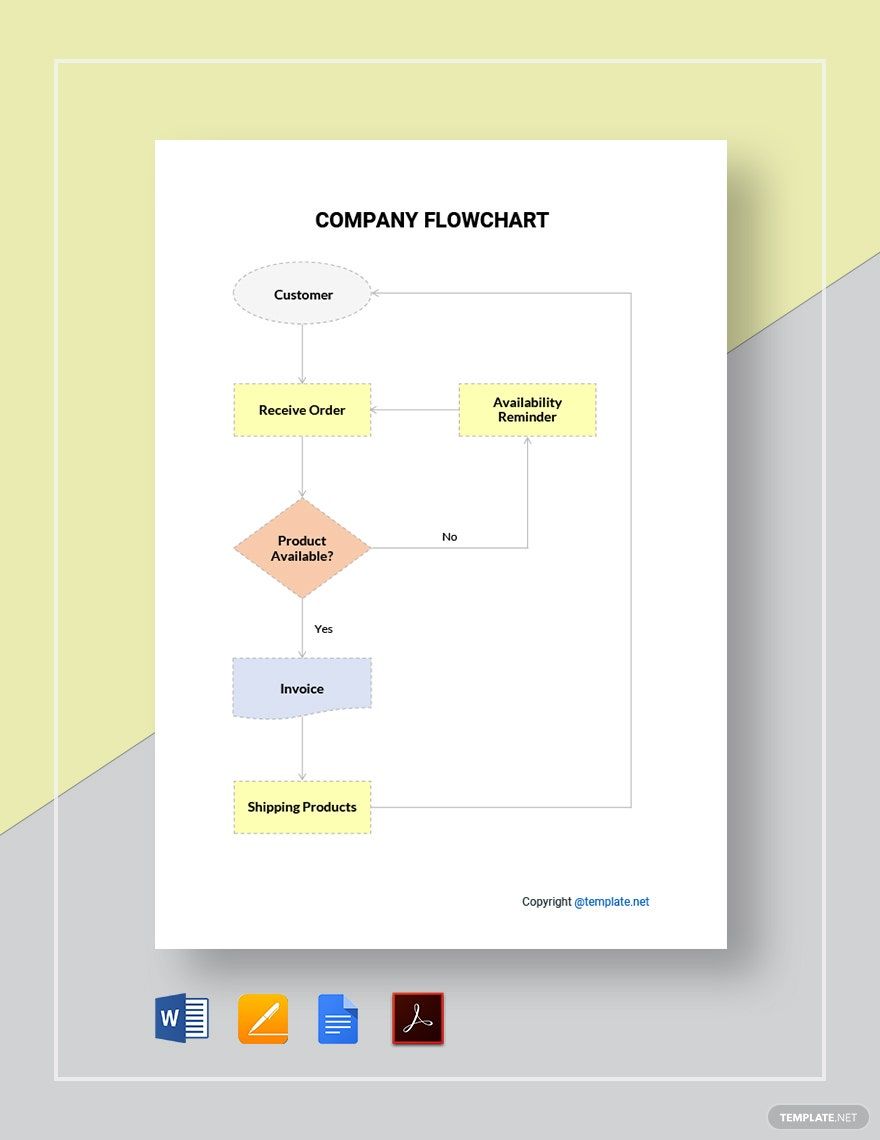
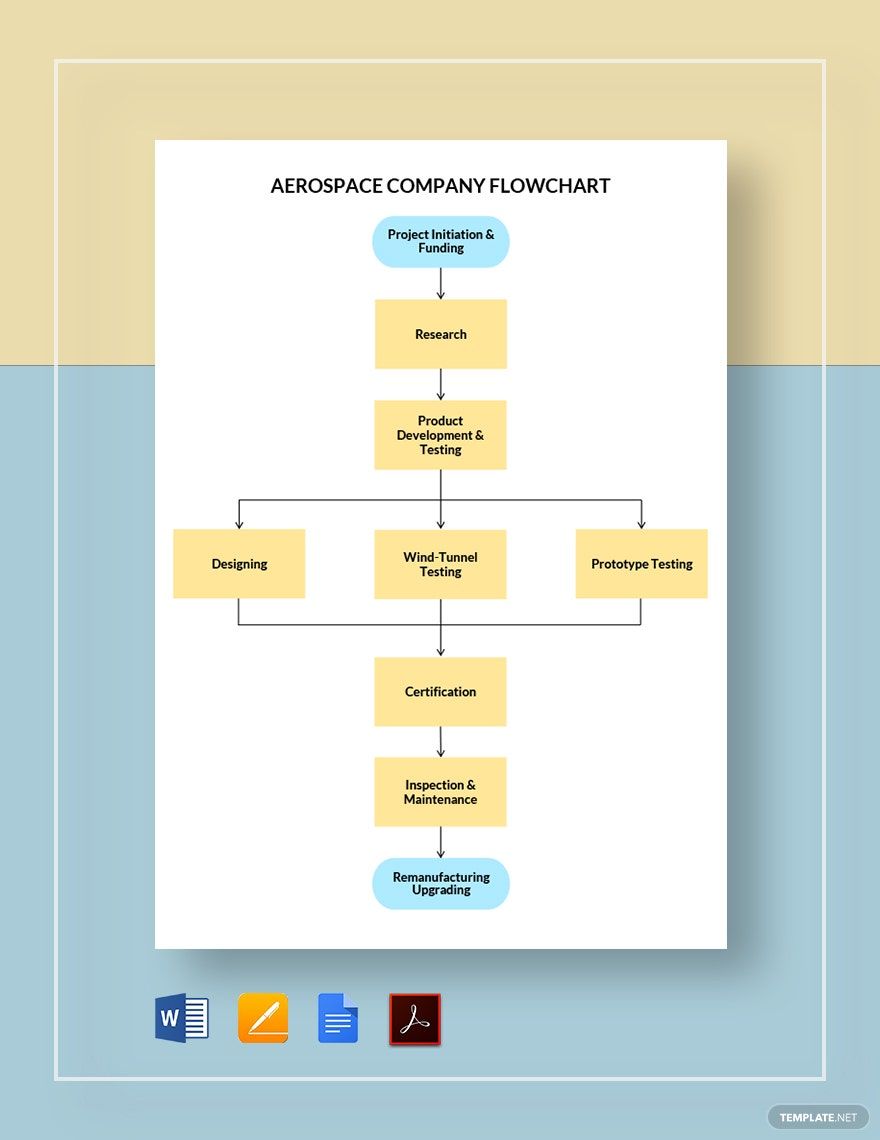
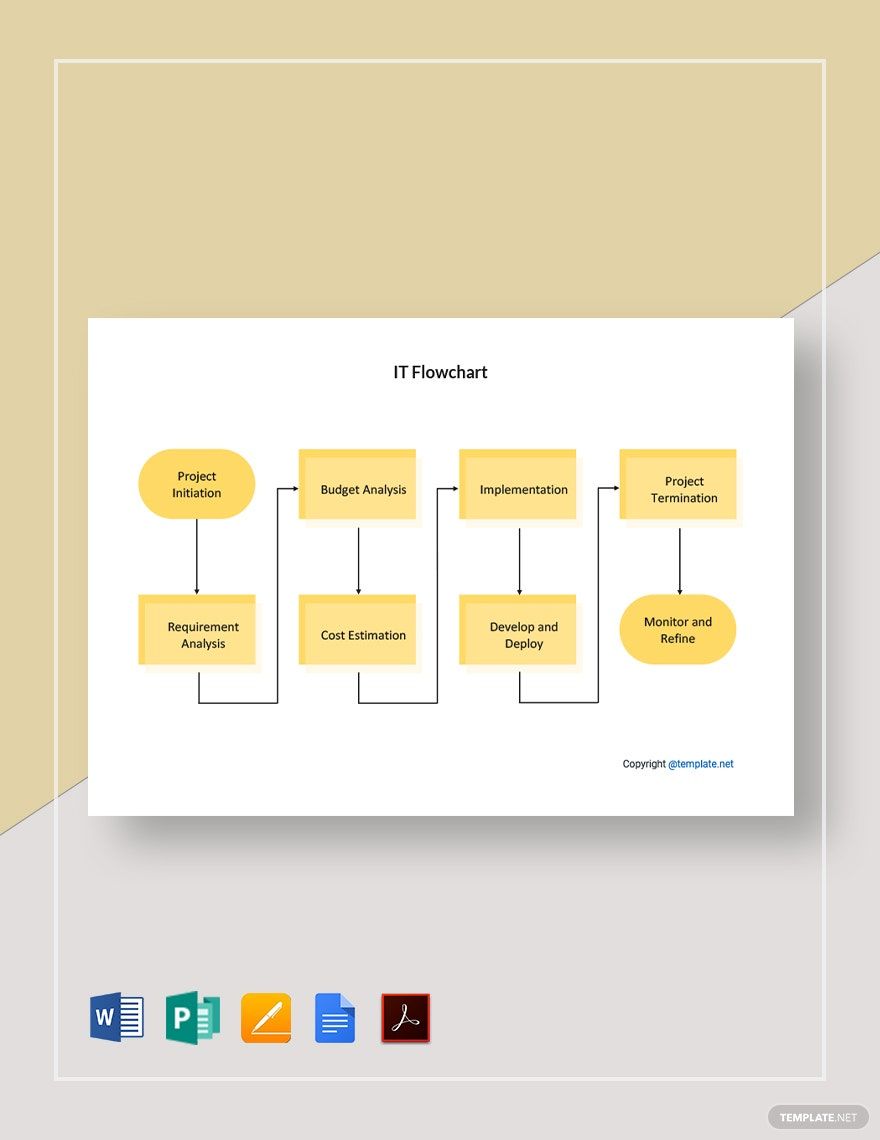
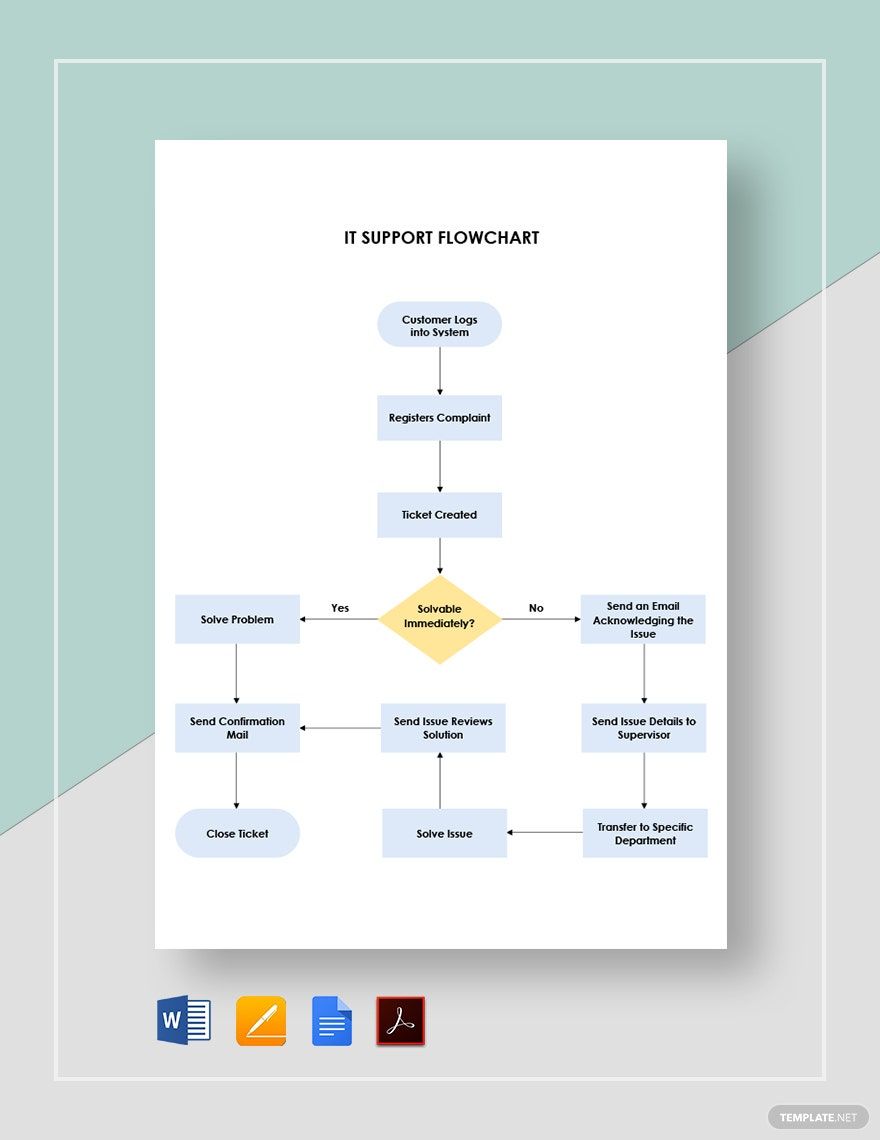
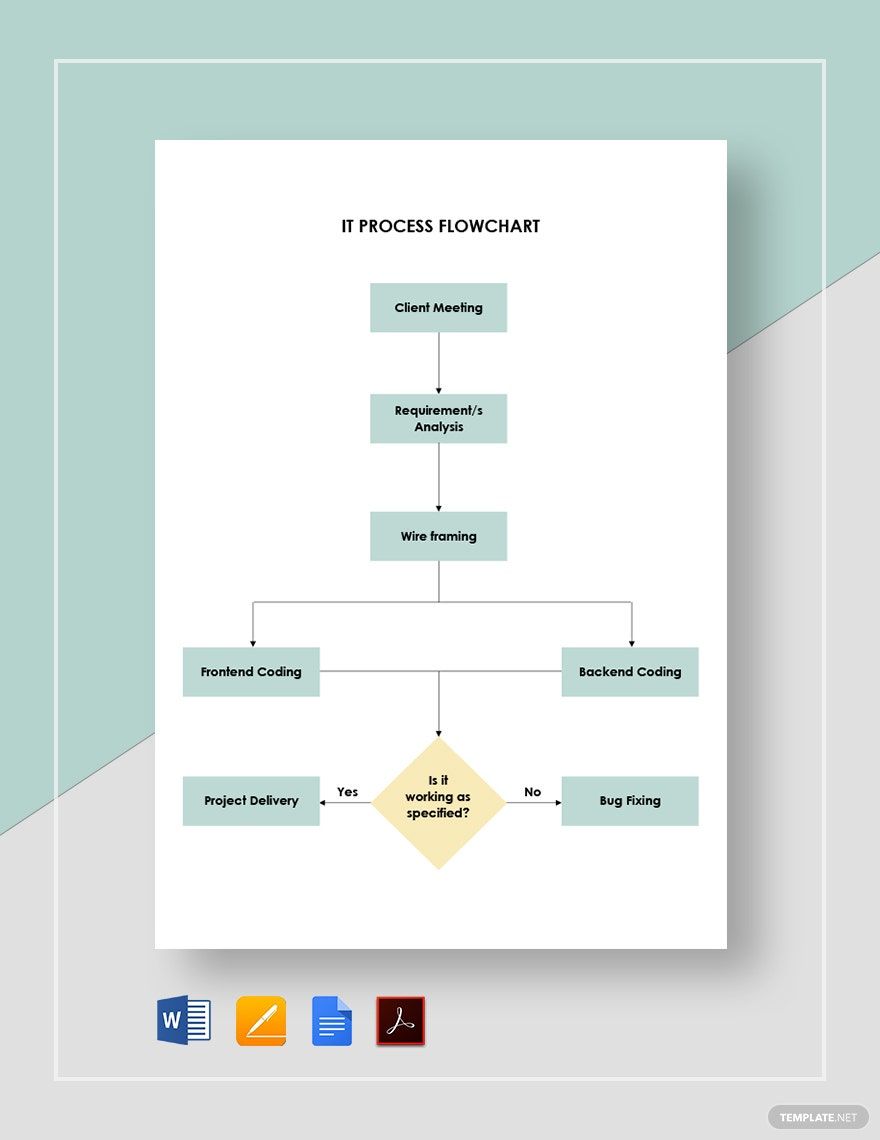
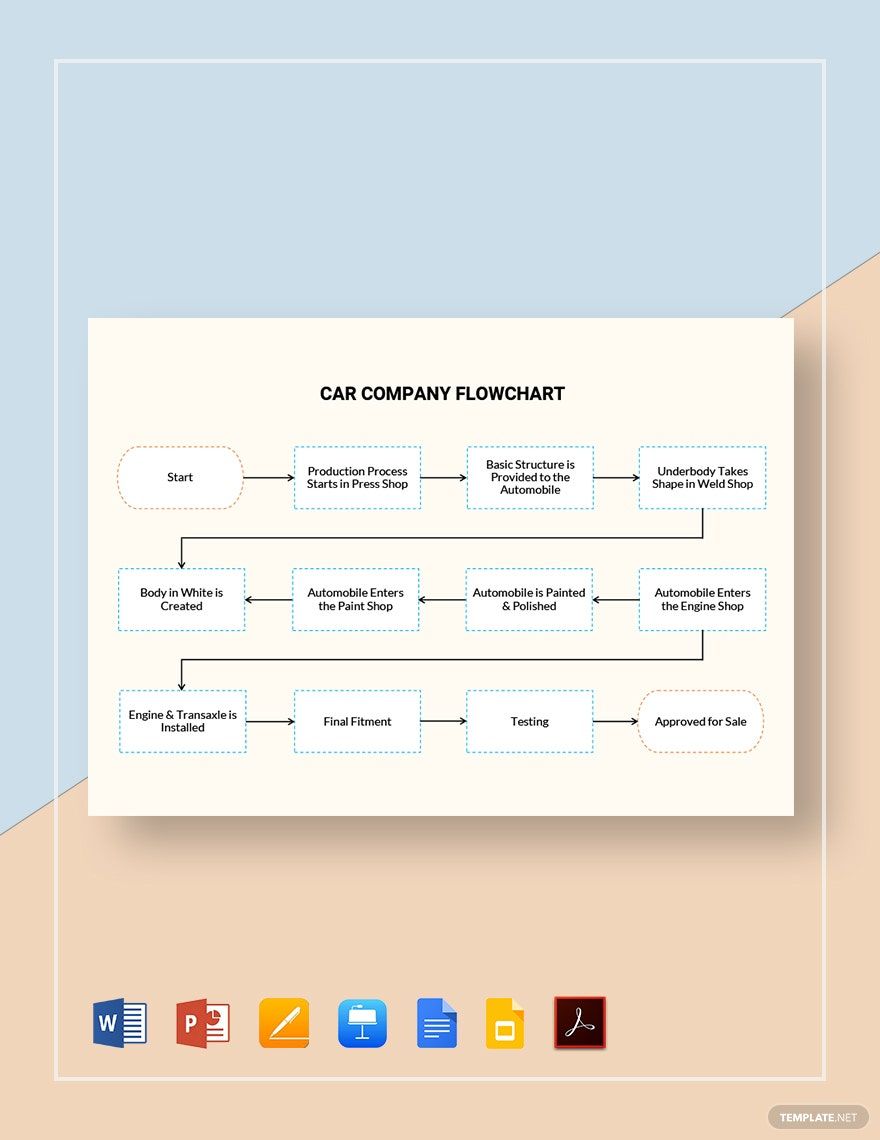
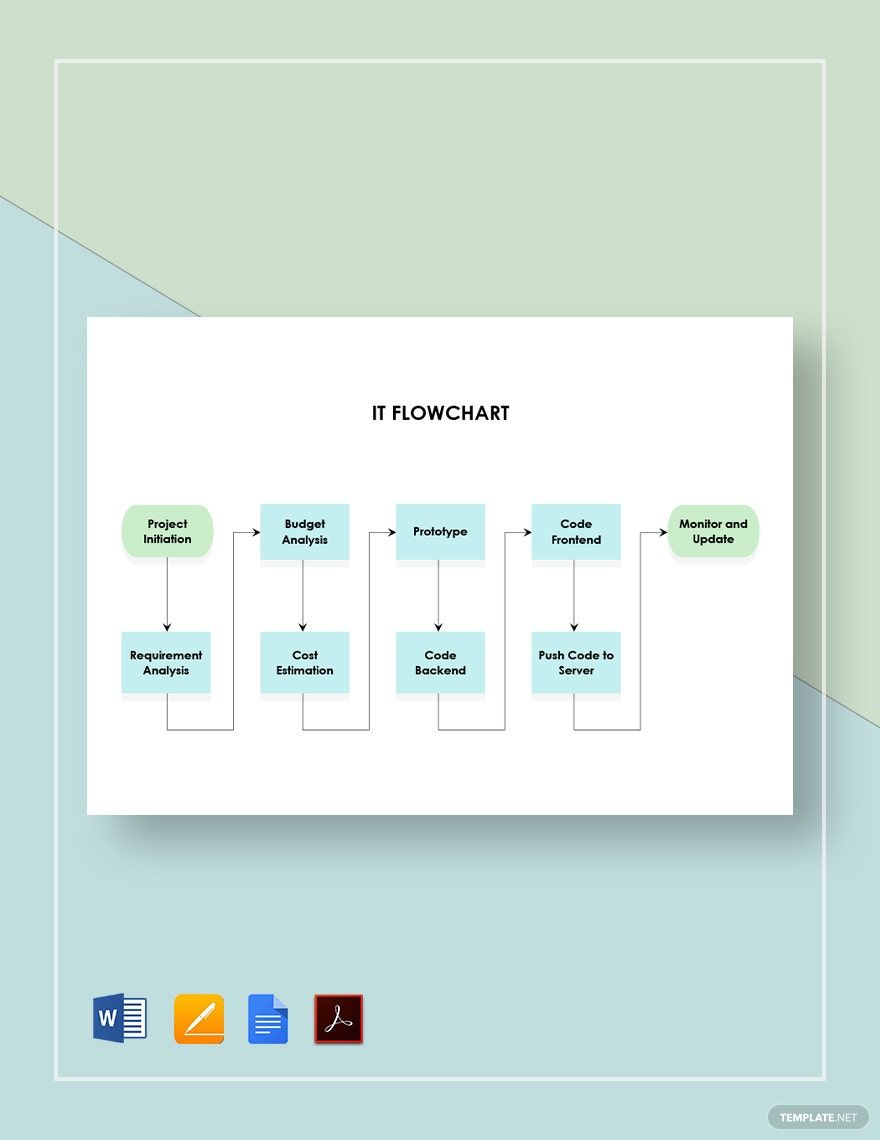
Information and technology have been very helpful to businesses of all scales and industries. It makes a certain company’s operations more convenient through its internal and external communication solutions. However, your IT company cannot handle other entities better if you are having difficulties troubleshooting your own problems. It’s a good thing that we have prepared a selection of IT Flowchart Templates in Apple Pages for you. Its high-quality and easily editable elements will help you create a visual paradigm of your structures in product development flow, management systems, and more. Visualize processes effectively by subscribing to our templates today!
IT Flowchart Template in Apple Pages, Imac
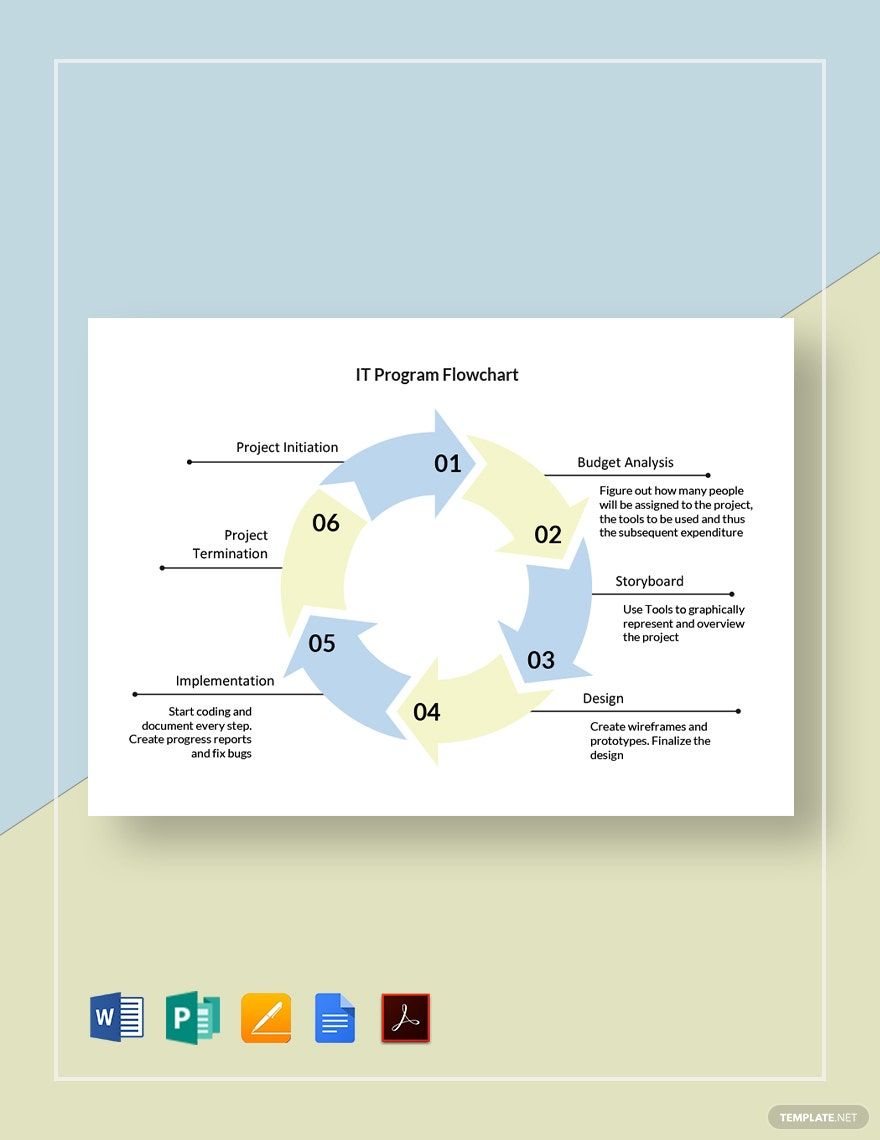
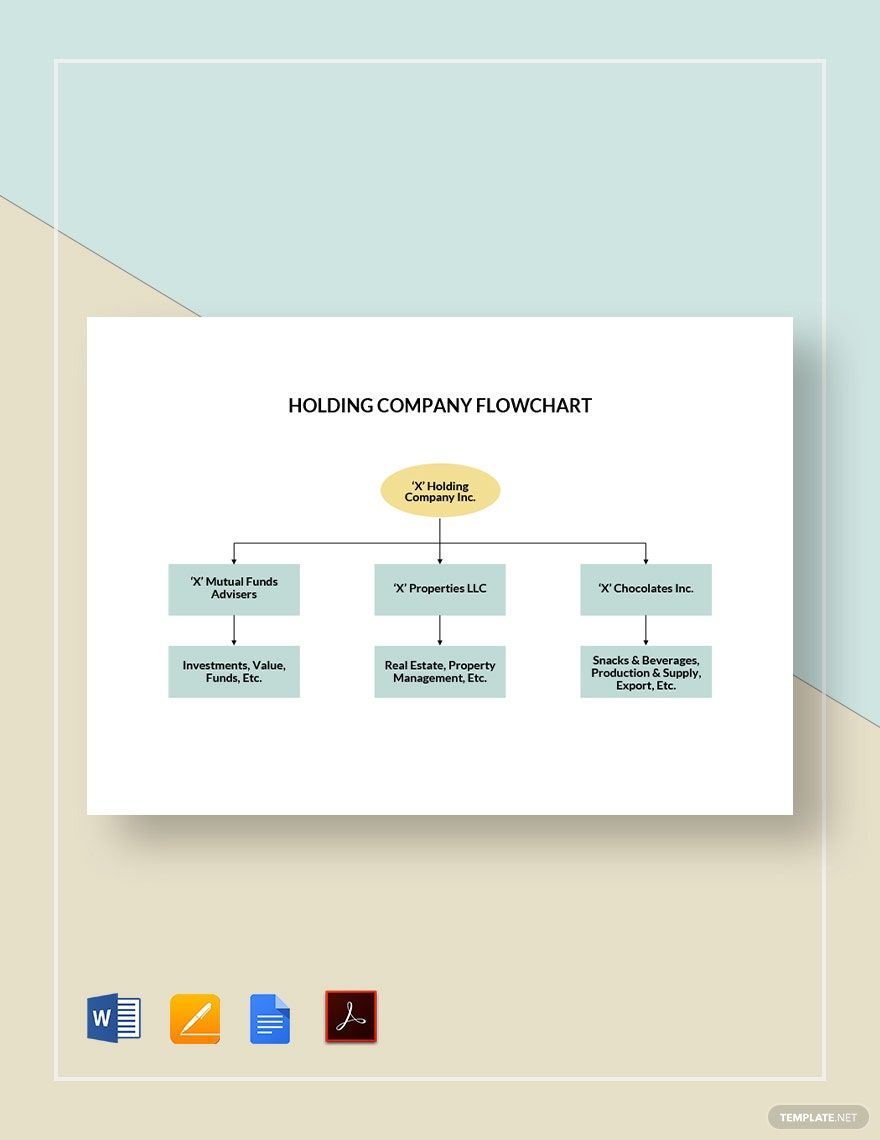
Need Help Creating an IT Flowchart? Template.net Helps You Save Time and Money with Our Predesigned IT Flowchart Templates. Download Simple, Basic, or Creative IT Organizational Charts and IT Department Process Flow Diagrams, Engineering Software Diagrams, or Computer Troubleshooting Diagrams for your IT Company’s Different Departments. All Templates Are Downloadable for Free in Apple Pages.
How to Design an IT Flowchart in Apple Pages
According to the website, ConceptDraw, computer programmers rely on flowcharts to illustrate and keep track of the processes when developing their programs. If you need to make one for your IT business, then the guidelines laid out below will surely come in handy.
1. Determine the Purpose for Making a Flowchart
The world of information technology covers a lot of processes relating to the handling and manipulation of computer data. If you’re planning on designing a flowchart, determine what it’s for and what area in IT you will cover. Doing so will give you a better picture of how to structure the chart.
2. Decide on a Type of Flowchart
When we say flowcharts, there’s actually more than just one to choose from. There’s the process flowchart, workflow diagram, and the data flow diagram, to name a few. Before you start making one, be sure to understand each type and decide which one suits your purpose best.
3. Identify the Elements to Include in Your Flowchart
After deciding on a type of flowchart, start laying out the elements that you want to include in it. For now, don’t limit yourself when making a list of the elements. Write as many as you can that you think are relevant. Get into details if you need to, you can always narrow it down afterward.
4. Start a New Project in Apple Pages
Start creating your actual IT flowchart launching Apple Pages and opening a new document file. This software application may be a word processor but it can also create basic symbols and shapes. When adding your content, refer to the list of elements that you prepared earlier.
5. Fine-tune the Contents and Design of the Flowchart
Go over your flowchart and check if there’s still room for improvement. Remove any misleading or unnecessary content. This will also help make the layout more spacious and neat. If you’re using symbols, provide meaning to each one by adding a legend. Also, add visual enhancements to the design if it looks too dull.
Frequently Asked Questions
What is an IT flowchart?
An IT flowchart is a graphical diagram that IT companies use to illustrate processes or procedures. Since this is used by an IT company, its processes will likely include data gathering, storage, manipulation, and sharing.
Why do companies use flowcharts?
- Flowcharts help them identify clearly the tasks involved in a process.
- Flowcharts enable them to see errors and loopholes for faster and easier troubleshooting.
- Flowcharts help improve the team’s coordination and level of efficiency.
What are the components of a flowchart?
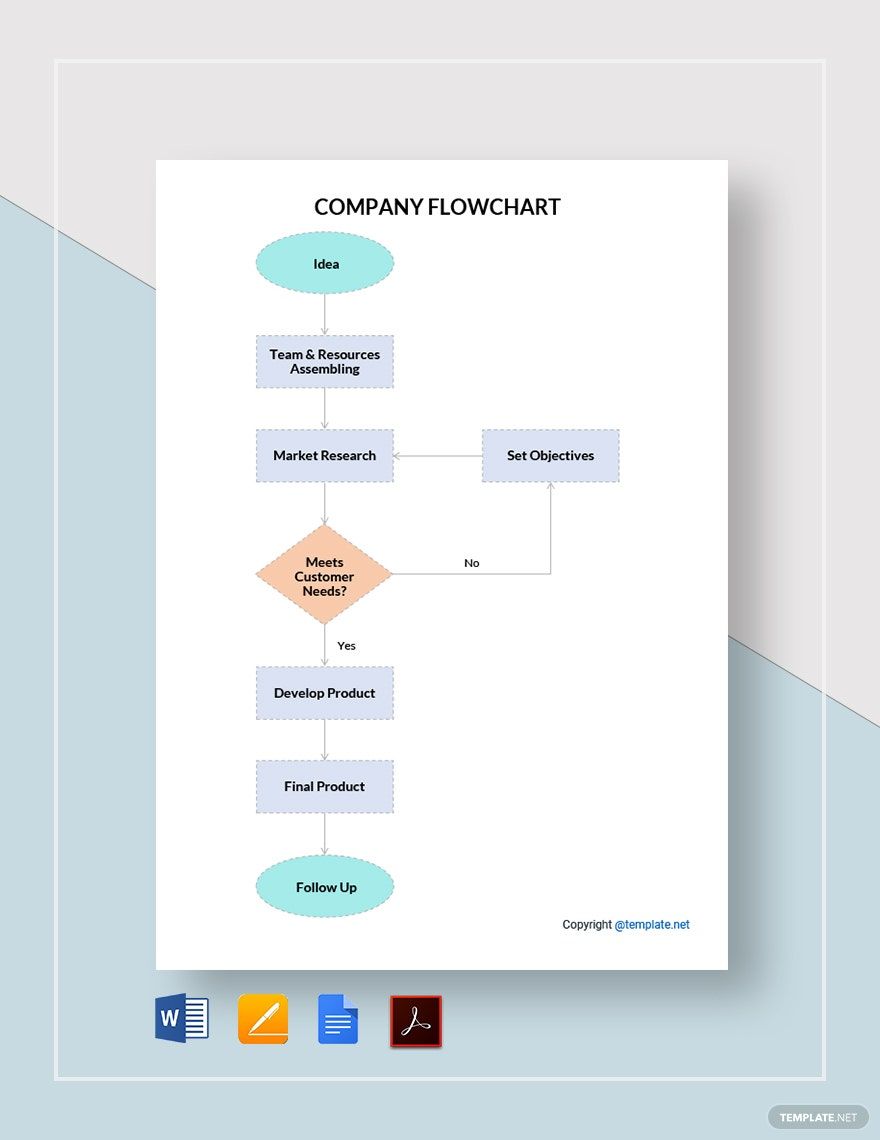
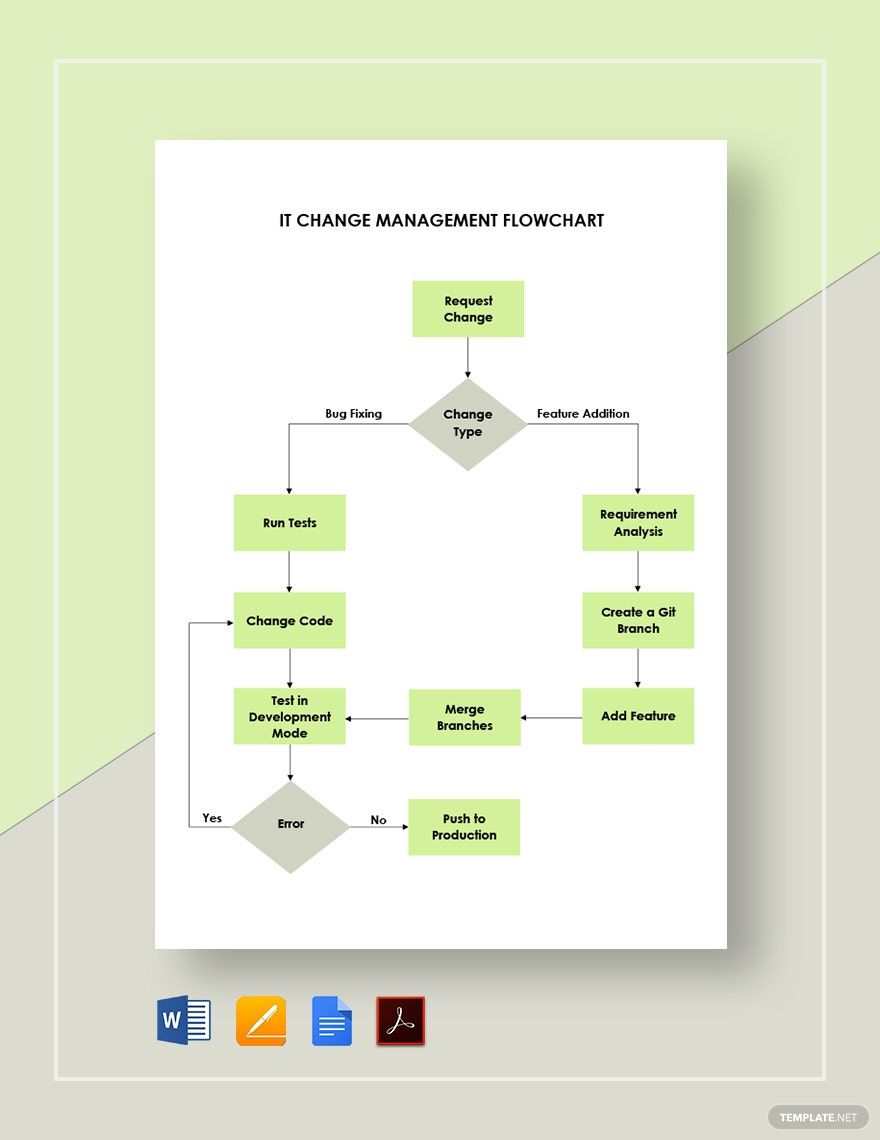
- Terminator - This symbolizes both the beginning and end of the flowchart.
- Processes - Represented by rectangles, these involve the actions taken throughout the process.
- Arrows - Directional symbols for guiding the reader.
- Decisions - Represented by diamonds, these are points where the path splits into two directions.
What are the types of flowcharts?
- Process flowchart - A type of flowchart that illustrates the flow of tasks to produce goods.
- Data flowchart - A type used in structural analysis, this is common in data management and in getting an overview of a system.
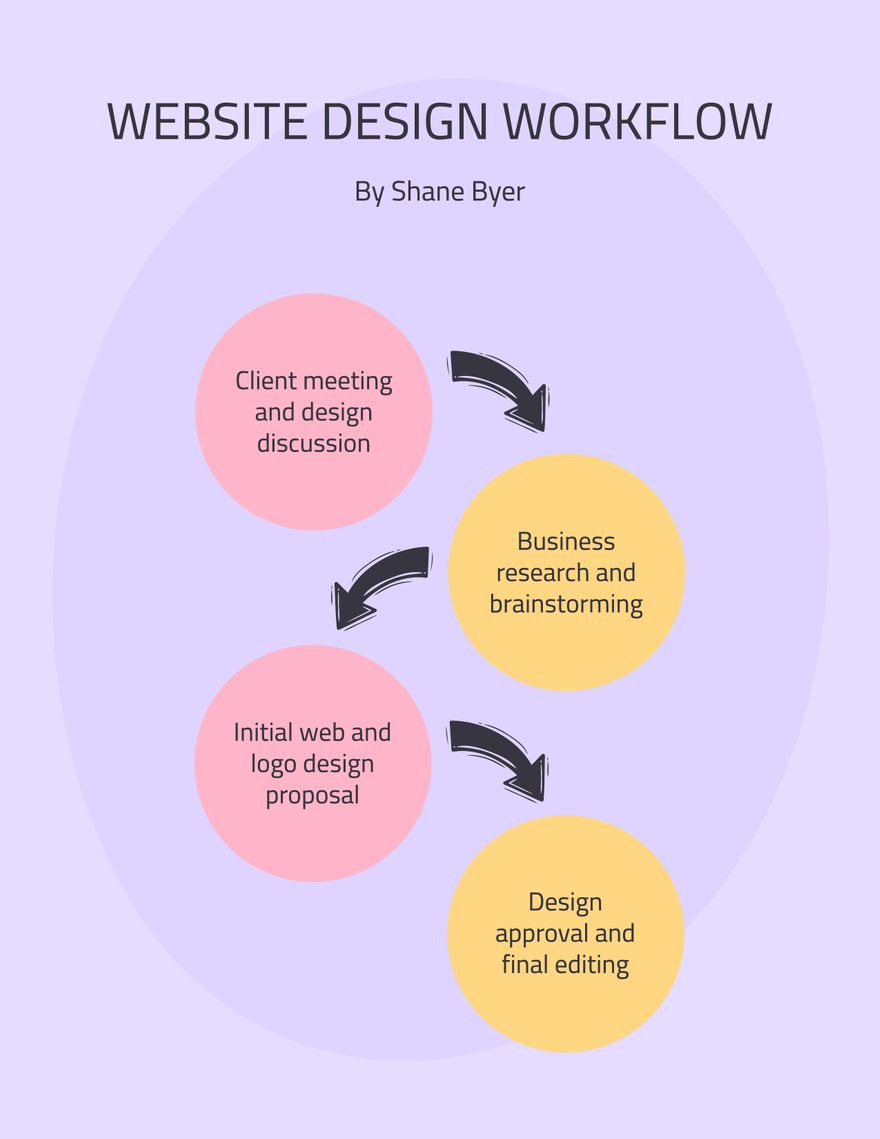
- Workflow diagram - A flowchart type to illustrate the delegation of tasks among employees.
How should you not make your flowchart?
- Not formatting your flowchart from left to right or from top to bottom.
- Not using the standard symbols for the flowchart’s elements.
- Adding distracting descriptions instead of using a footnote.
